| __timestamp | Hewlett Packard Enterprise Company | International Business Machines Corporation |
|---|---|---|
| Wednesday, January 1, 2014 | 39486000000 | 46386000000 |
| Thursday, January 1, 2015 | 37168000000 | 41057000000 |
| Friday, January 1, 2016 | 35507000000 | 41403000000 |
| Sunday, January 1, 2017 | 20177000000 | 42196000000 |
| Monday, January 1, 2018 | 21560000000 | 42655000000 |
| Tuesday, January 1, 2019 | 19642000000 | 26181000000 |
| Wednesday, January 1, 2020 | 18513000000 | 24314000000 |
| Friday, January 1, 2021 | 18408000000 | 25865000000 |
| Saturday, January 1, 2022 | 18990000000 | 27842000000 |
| Sunday, January 1, 2023 | 18896000000 | 27560000000 |
| Monday, January 1, 2024 | 20283000000 | 27202000000 |
Data in motion
In the ever-evolving landscape of technology, understanding the cost structures of industry giants like International Business Machines Corporation (IBM) and Hewlett Packard Enterprise Company (HPE) offers valuable insights. Over the past decade, from 2014 to 2024, both companies have navigated significant shifts in their cost of revenue.
IBM, a stalwart in the tech industry, saw its cost of revenue peak in 2014, with a gradual decline of approximately 41% by 2024. This trend reflects IBM's strategic pivot towards more efficient operations and a focus on high-margin services.
Conversely, HPE experienced a sharper decline, with its cost of revenue dropping by nearly 49% over the same period. This reduction underscores HPE's successful restructuring efforts and its emphasis on innovation and streamlined operations.
These trends highlight the dynamic nature of the tech industry, where adaptability and strategic foresight are key to maintaining competitive advantage.
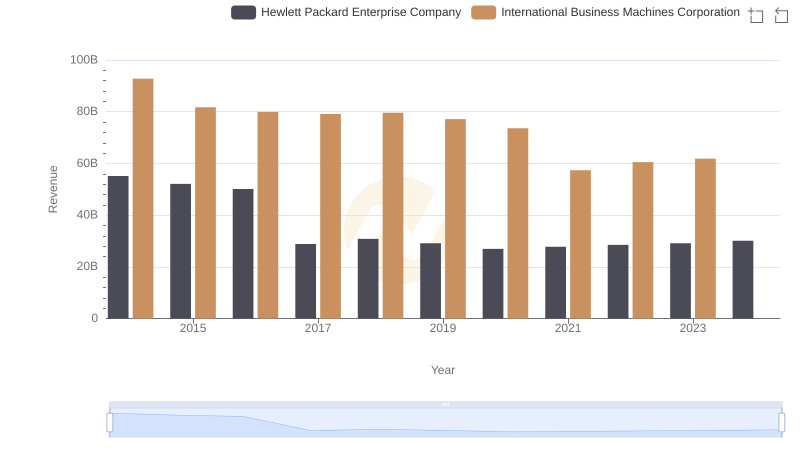
Who Generates More Revenue? International Business Machines Corporation or Hewlett Packard Enterprise Company
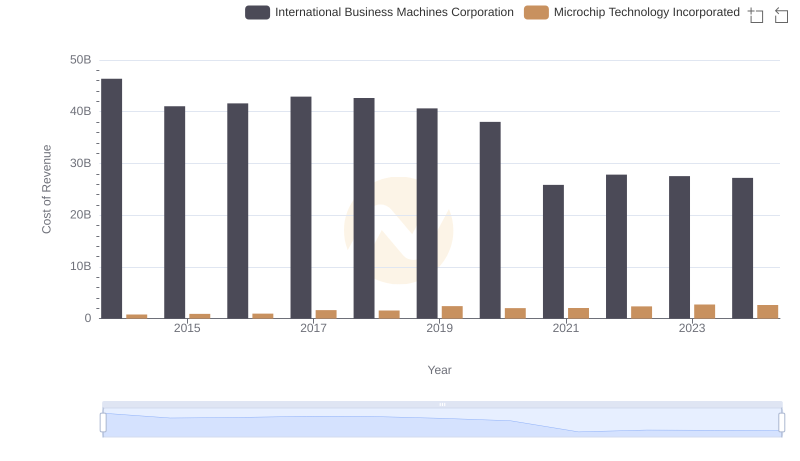
Comparing Cost of Revenue Efficiency: International Business Machines Corporation vs Microchip Technology Incorporated
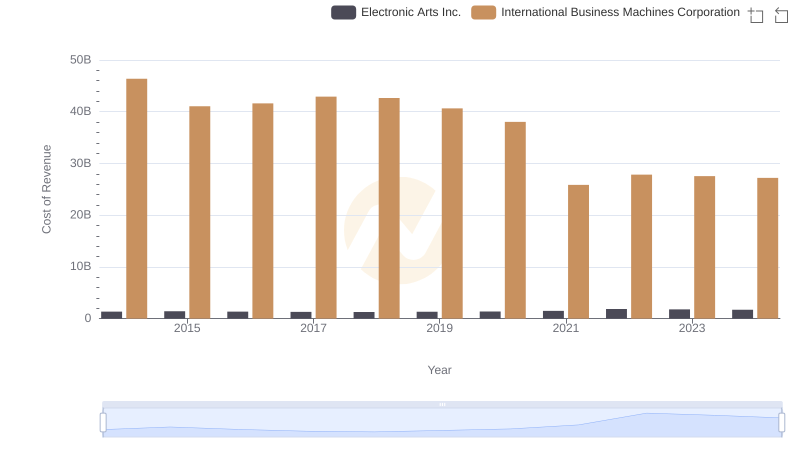
Comparing Cost of Revenue Efficiency: International Business Machines Corporation vs Electronic Arts Inc.
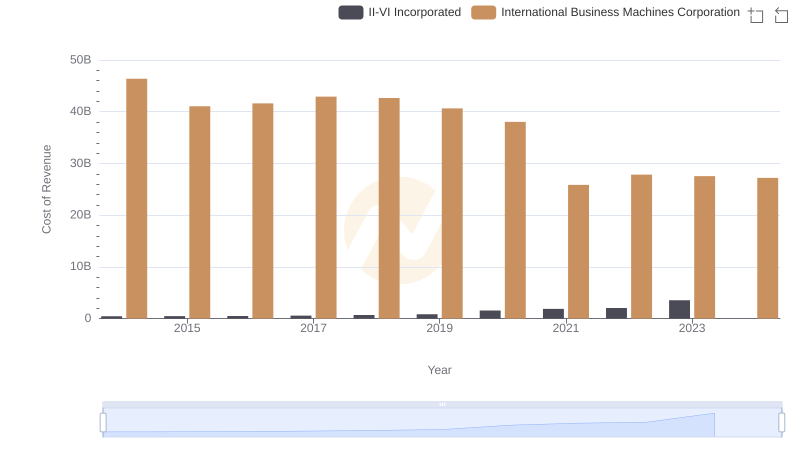
Analyzing Cost of Revenue: International Business Machines Corporation and II-VI Incorporated
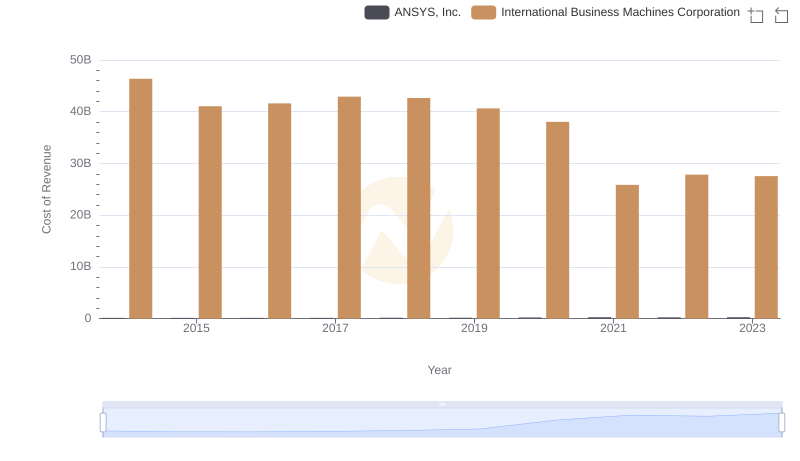
Cost of Revenue: Key Insights for International Business Machines Corporation and ANSYS, Inc.
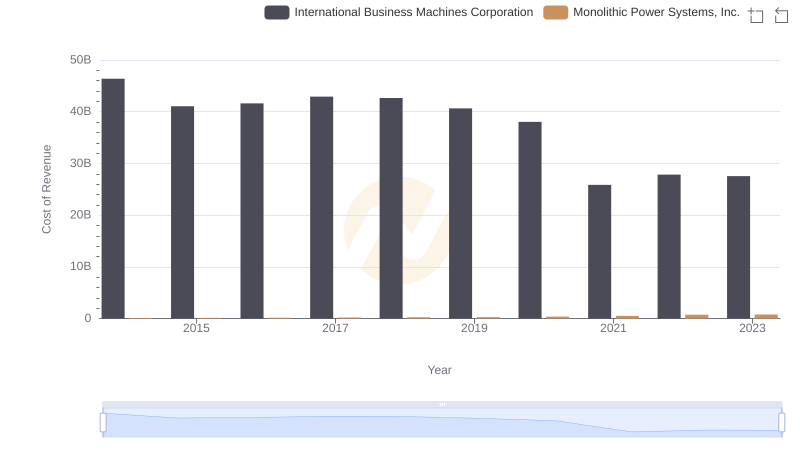
Cost of Revenue Comparison: International Business Machines Corporation vs Monolithic Power Systems, Inc.
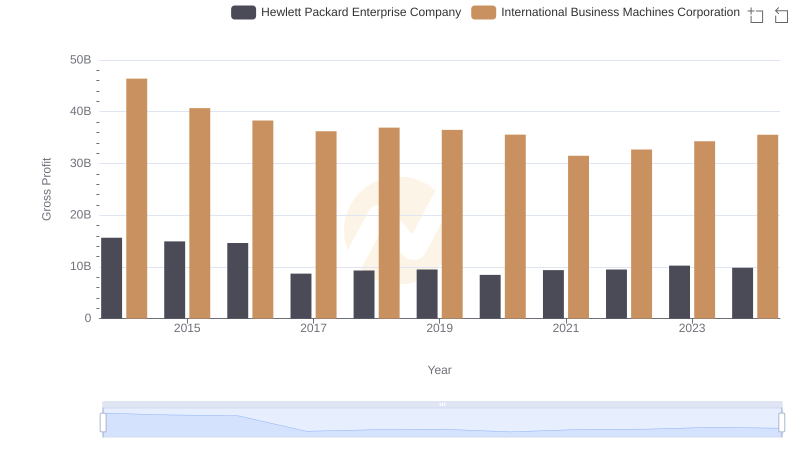
Gross Profit Analysis: Comparing International Business Machines Corporation and Hewlett Packard Enterprise Company
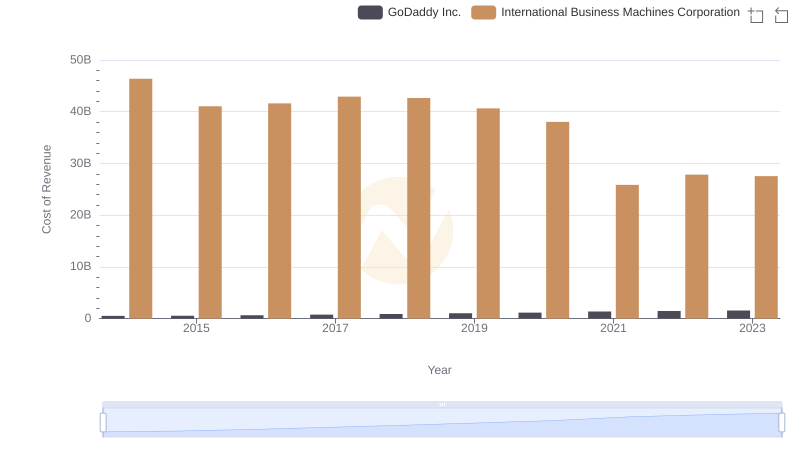
Cost Insights: Breaking Down International Business Machines Corporation and GoDaddy Inc.'s Expenses
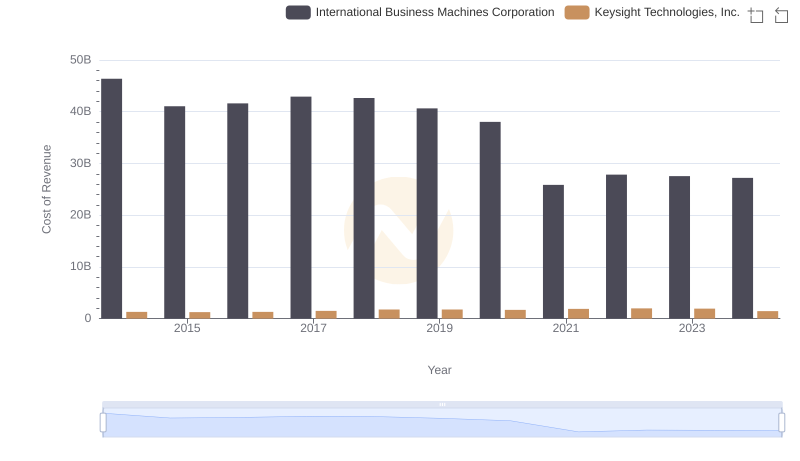
Cost of Revenue Trends: International Business Machines Corporation vs Keysight Technologies, Inc.
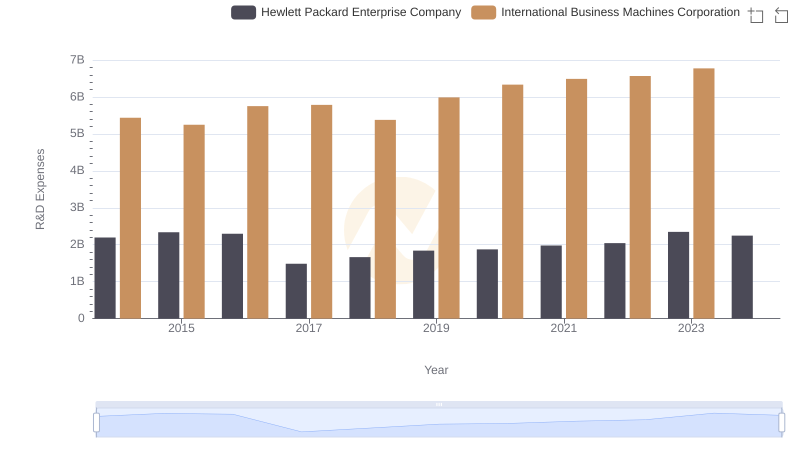
Research and Development Investment: International Business Machines Corporation vs Hewlett Packard Enterprise Company
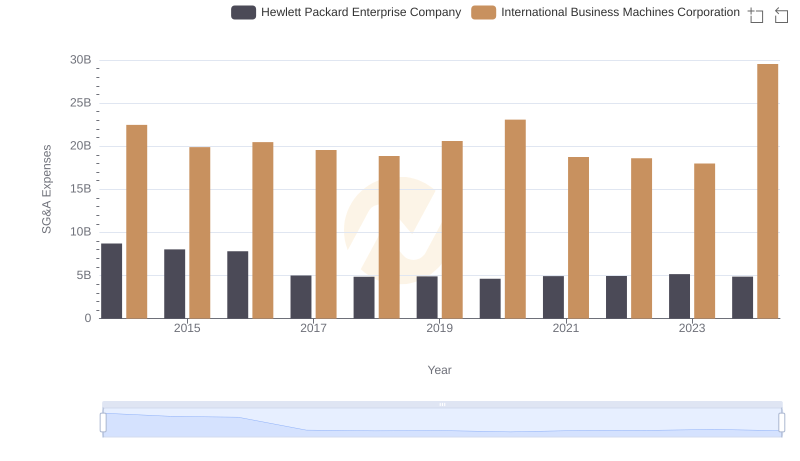
Comparing SG&A Expenses: International Business Machines Corporation vs Hewlett Packard Enterprise Company Trends and Insights
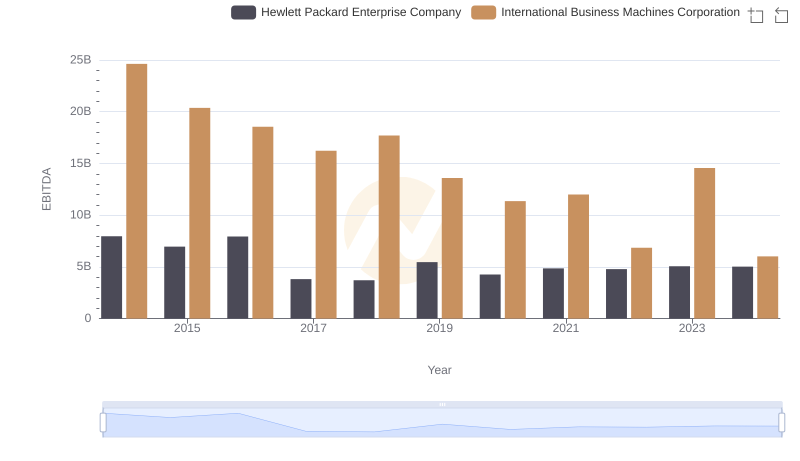
A Side-by-Side Analysis of EBITDA: International Business Machines Corporation and Hewlett Packard Enterprise Company