| __timestamp | International Business Machines Corporation | Keysight Technologies, Inc. |
|---|---|---|
| Wednesday, January 1, 2014 | 46386000000 | 1313000000 |
| Thursday, January 1, 2015 | 41057000000 | 1264000000 |
| Friday, January 1, 2016 | 41403000000 | 1294000000 |
| Sunday, January 1, 2017 | 42196000000 | 1487000000 |
| Monday, January 1, 2018 | 42655000000 | 1767000000 |
| Tuesday, January 1, 2019 | 26181000000 | 1769000000 |
| Wednesday, January 1, 2020 | 24314000000 | 1688000000 |
| Friday, January 1, 2021 | 25865000000 | 1872000000 |
| Saturday, January 1, 2022 | 27842000000 | 1970000000 |
| Sunday, January 1, 2023 | 27560000000 | 1932000000 |
| Monday, January 1, 2024 | 27202000000 | 1452000000 |
Unlocking the unknown
In the ever-evolving landscape of technology, understanding cost dynamics is crucial. From 2014 to 2024, International Business Machines Corporation (IBM) and Keysight Technologies, Inc. have shown contrasting trends in their cost of revenue. IBM, a stalwart in the tech industry, saw a significant decline of approximately 41% in its cost of revenue, from a peak in 2014 to 2024. This reduction reflects IBM's strategic shift towards more efficient operations and a focus on high-margin services. Meanwhile, Keysight Technologies, a leader in electronic measurement solutions, experienced a steady increase of about 11% over the same period, indicating its expanding market presence and investment in innovation. These trends highlight the diverse strategies of two major players in the tech sector, offering insights into their financial health and operational strategies.
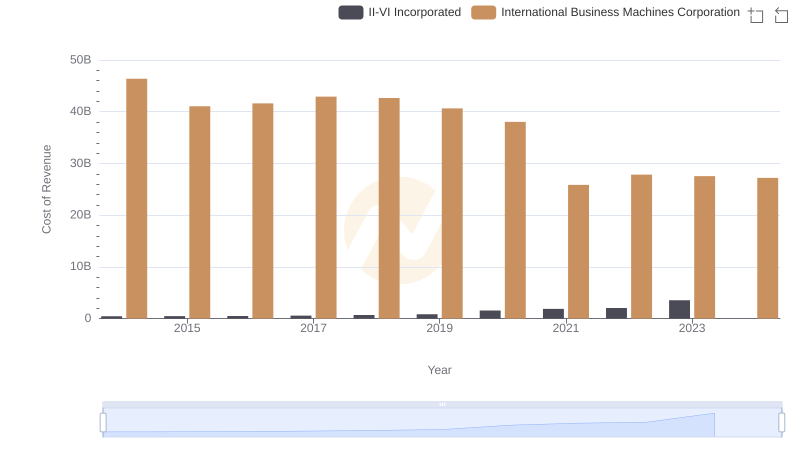
Analyzing Cost of Revenue: International Business Machines Corporation and II-VI Incorporated
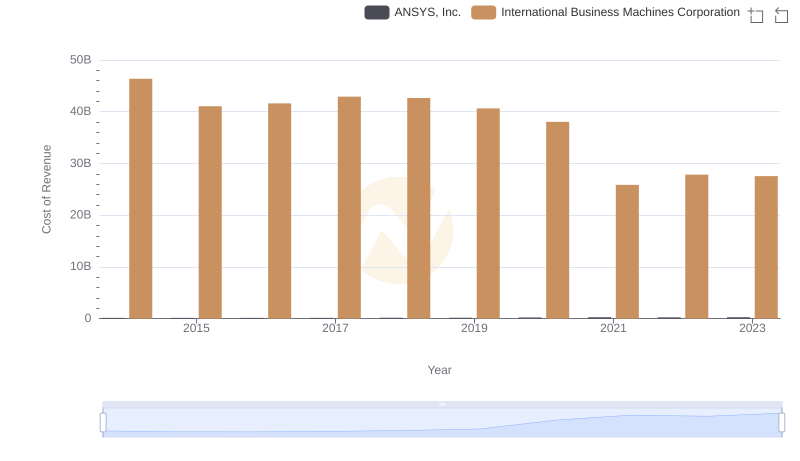
Cost of Revenue: Key Insights for International Business Machines Corporation and ANSYS, Inc.
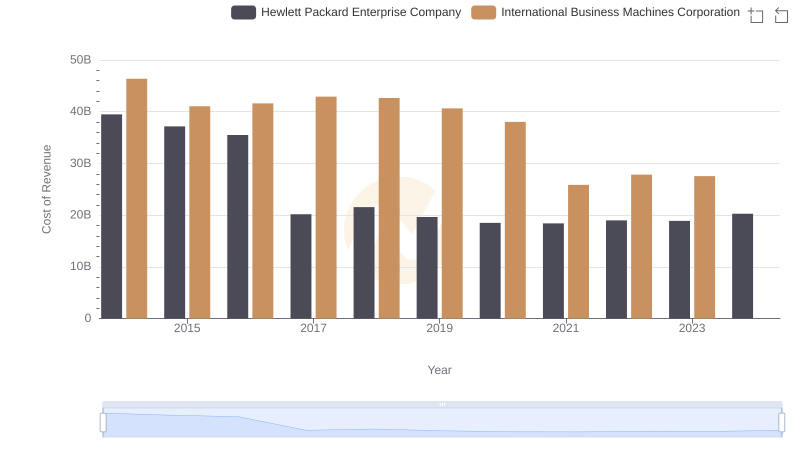
Analyzing Cost of Revenue: International Business Machines Corporation and Hewlett Packard Enterprise Company
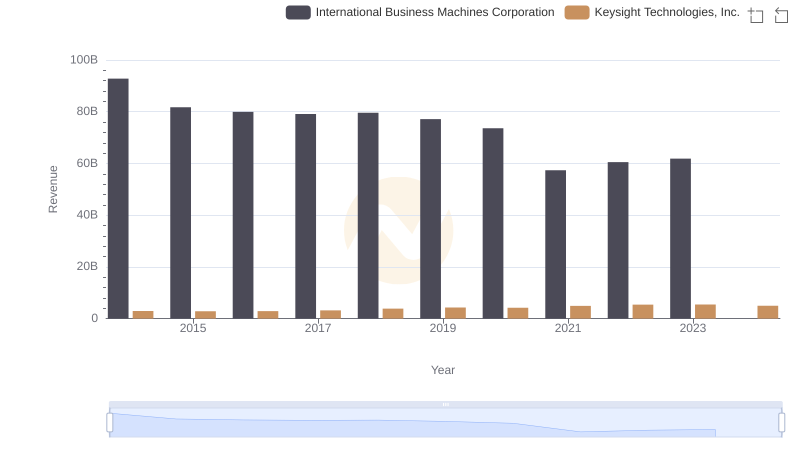
International Business Machines Corporation or Keysight Technologies, Inc.: Who Leads in Yearly Revenue?
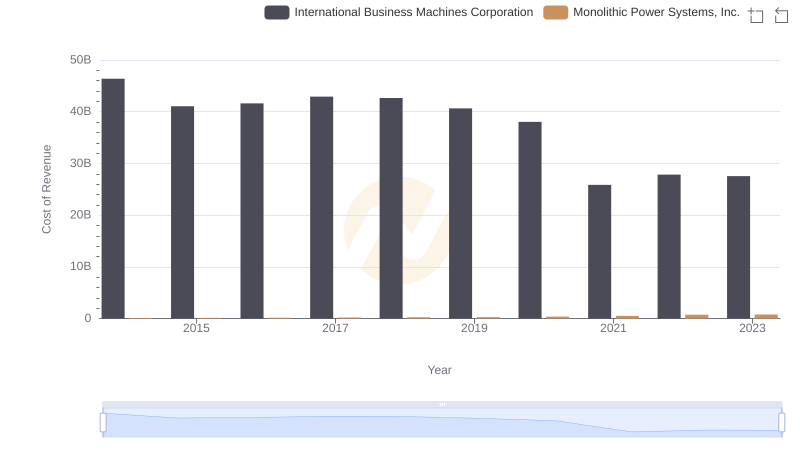
Cost of Revenue Comparison: International Business Machines Corporation vs Monolithic Power Systems, Inc.
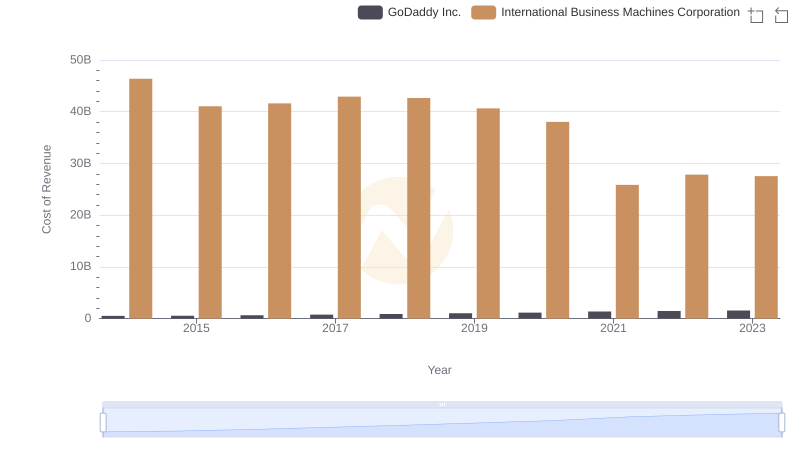
Cost Insights: Breaking Down International Business Machines Corporation and GoDaddy Inc.'s Expenses
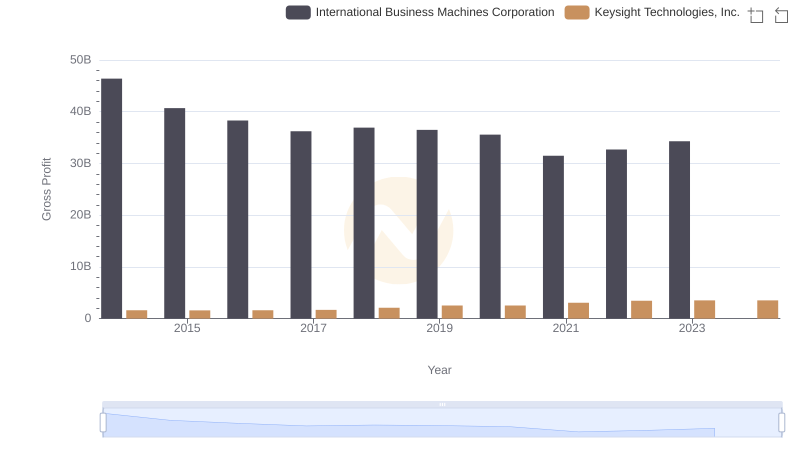
International Business Machines Corporation and Keysight Technologies, Inc.: A Detailed Gross Profit Analysis
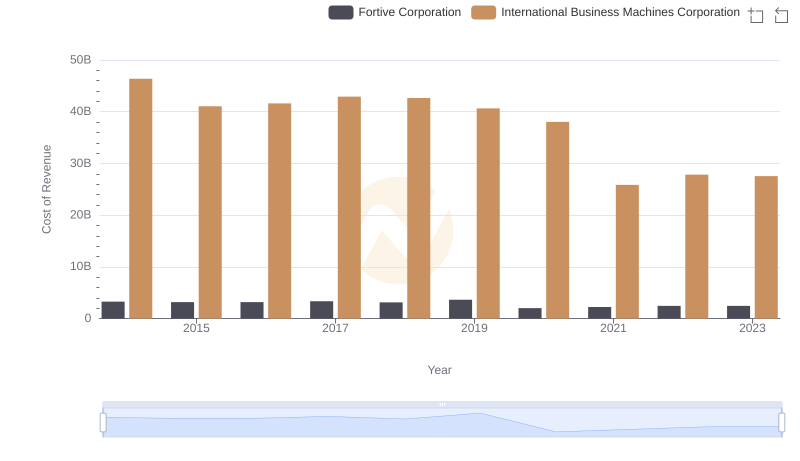
Cost of Revenue Comparison: International Business Machines Corporation vs Fortive Corporation

Analyzing Cost of Revenue: International Business Machines Corporation and Broadridge Financial Solutions, Inc.
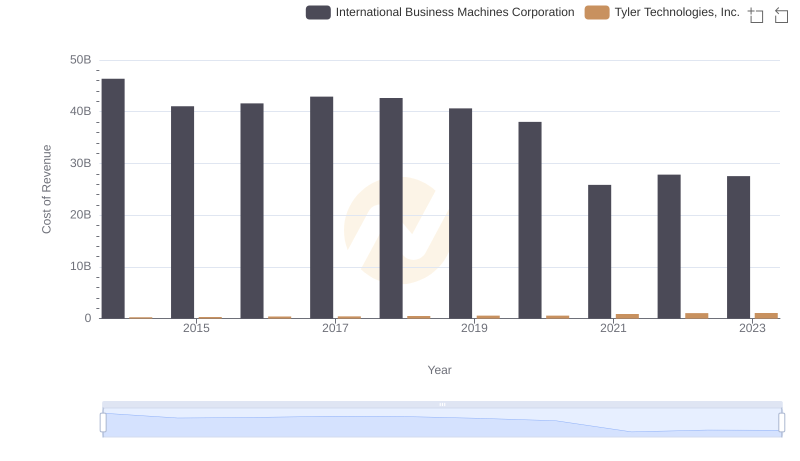
Cost of Revenue: Key Insights for International Business Machines Corporation and Tyler Technologies, Inc.
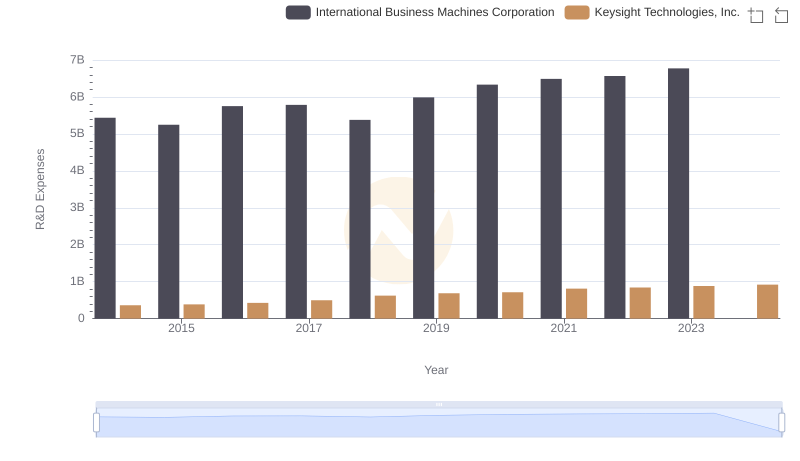
Research and Development Expenses Breakdown: International Business Machines Corporation vs Keysight Technologies, Inc.
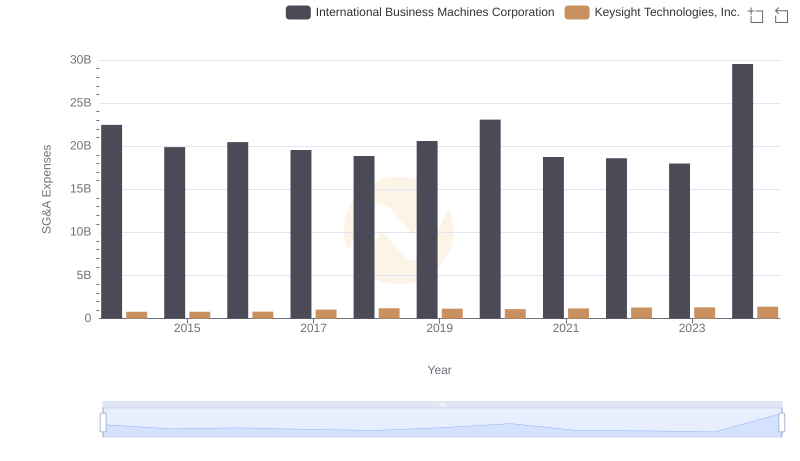
Cost Management Insights: SG&A Expenses for International Business Machines Corporation and Keysight Technologies, Inc.