| __timestamp | ANSYS, Inc. | International Business Machines Corporation |
|---|---|---|
| Wednesday, January 1, 2014 | 782635000 | 46407000000 |
| Thursday, January 1, 2015 | 795507000 | 40684000000 |
| Friday, January 1, 2016 | 841605000 | 38516000000 |
| Sunday, January 1, 2017 | 945086000 | 36943000000 |
| Monday, January 1, 2018 | 1137751000 | 36936000000 |
| Tuesday, January 1, 2019 | 1349619000 | 31533000000 |
| Wednesday, January 1, 2020 | 1456033000 | 30865000000 |
| Friday, January 1, 2021 | 1648731000 | 31486000000 |
| Saturday, January 1, 2022 | 1814912000 | 32687000000 |
| Sunday, January 1, 2023 | 1998651000 | 34300000000 |
| Monday, January 1, 2024 | 2264990000 | 35551000000 |
Infusing magic into the data realm
In the ever-evolving landscape of technology, two titans stand out: International Business Machines Corporation (IBM) and ANSYS, Inc. Over the past decade, these companies have showcased distinct trajectories in their gross profit margins. From 2014 to 2023, IBM's gross profit has seen a decline of approximately 26%, starting at a peak in 2014 and reaching its lowest in 2021. In contrast, ANSYS has experienced a robust growth of around 155% during the same period, reflecting its increasing market influence and strategic advancements.
This comparison highlights the dynamic nature of the tech industry, where innovation and adaptability are key. While IBM remains a stalwart with a significant gross profit, ANSYS's upward trend underscores its growing prominence. As we look to the future, these trends offer valuable insights into the shifting paradigms of technological leadership.

International Business Machines Corporation and ANSYS, Inc.: A Comprehensive Revenue Analysis
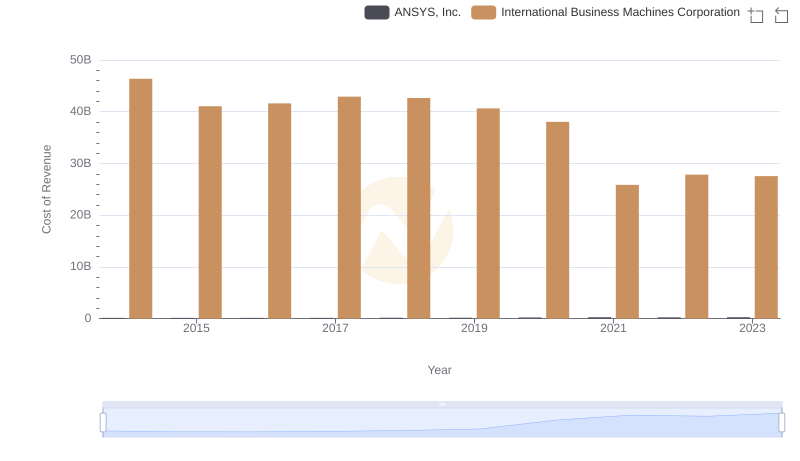
Cost of Revenue: Key Insights for International Business Machines Corporation and ANSYS, Inc.
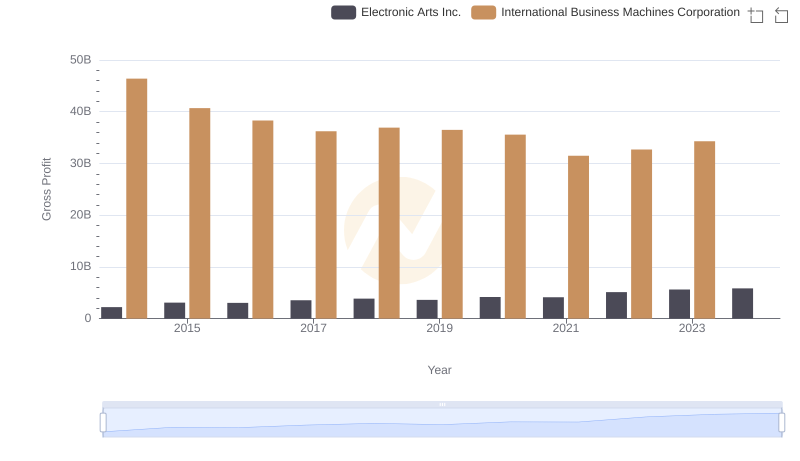
International Business Machines Corporation vs Electronic Arts Inc.: A Gross Profit Performance Breakdown
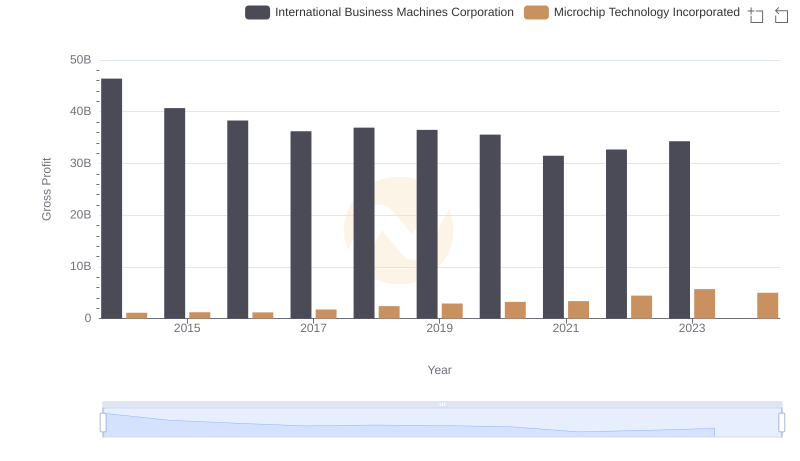
Gross Profit Analysis: Comparing International Business Machines Corporation and Microchip Technology Incorporated
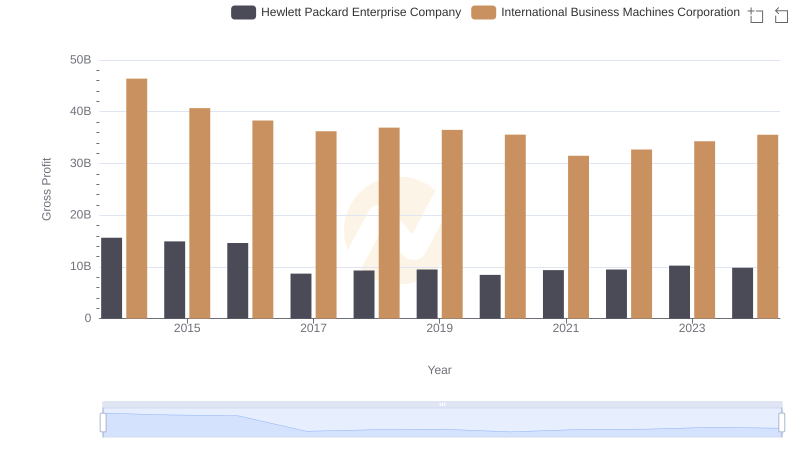
Gross Profit Analysis: Comparing International Business Machines Corporation and Hewlett Packard Enterprise Company
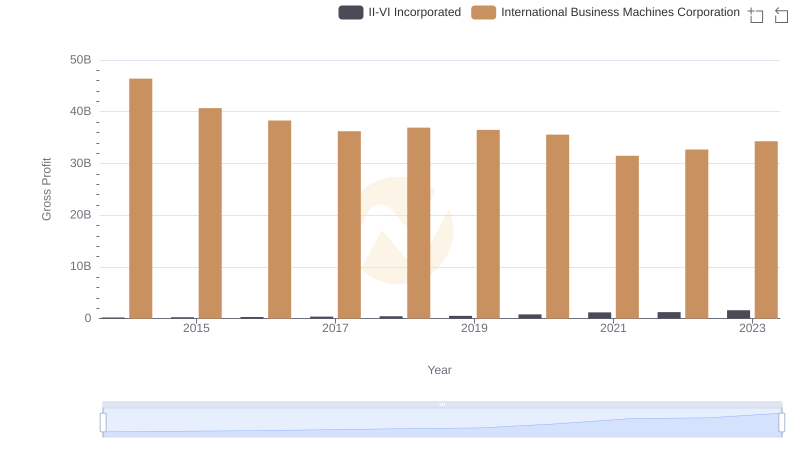
Gross Profit Trends Compared: International Business Machines Corporation vs II-VI Incorporated
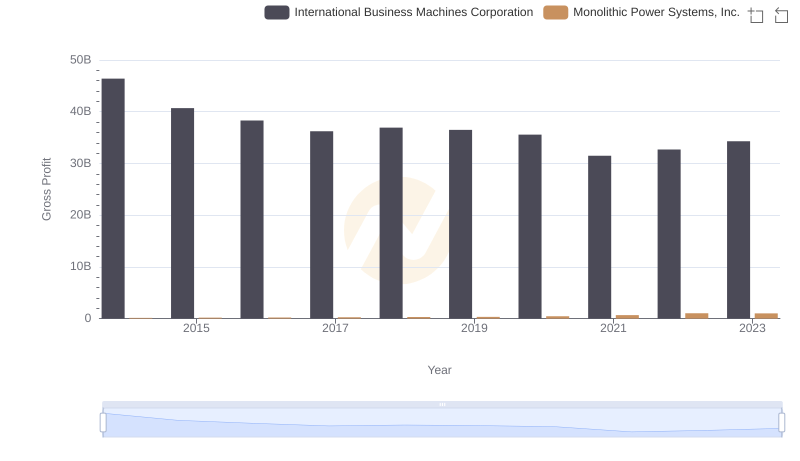
Key Insights on Gross Profit: International Business Machines Corporation vs Monolithic Power Systems, Inc.
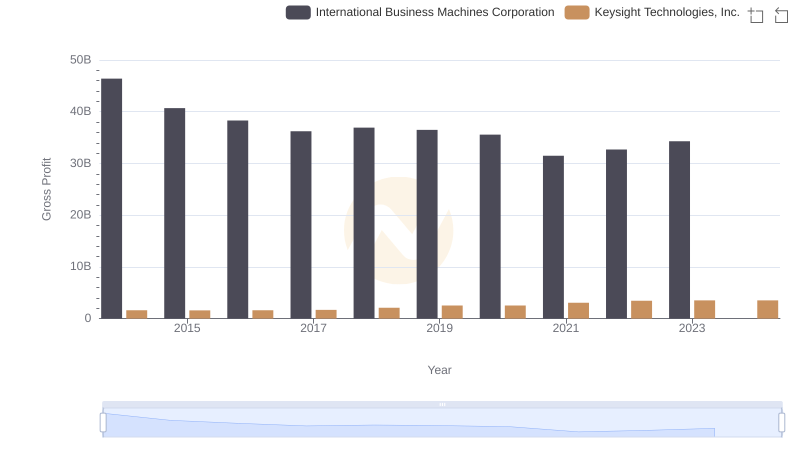
International Business Machines Corporation and Keysight Technologies, Inc.: A Detailed Gross Profit Analysis
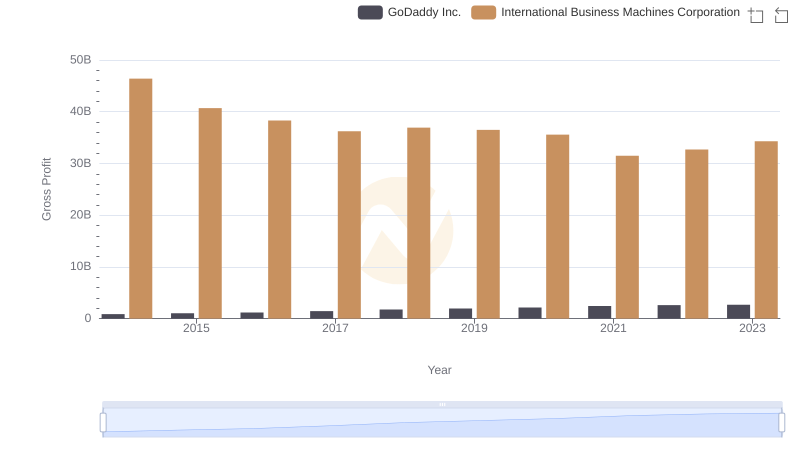
Gross Profit Comparison: International Business Machines Corporation and GoDaddy Inc. Trends
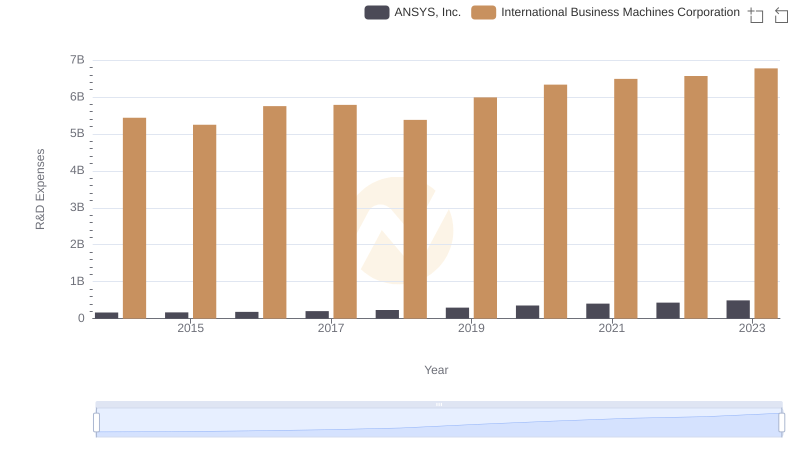
International Business Machines Corporation or ANSYS, Inc.: Who Invests More in Innovation?
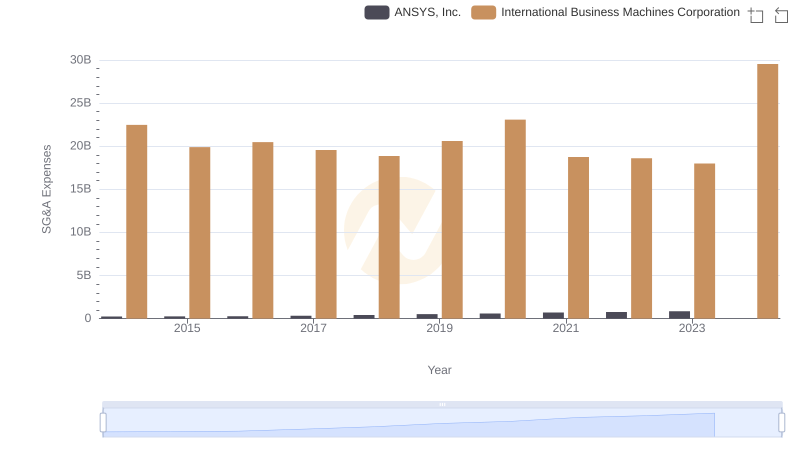
Comparing SG&A Expenses: International Business Machines Corporation vs ANSYS, Inc. Trends and Insights
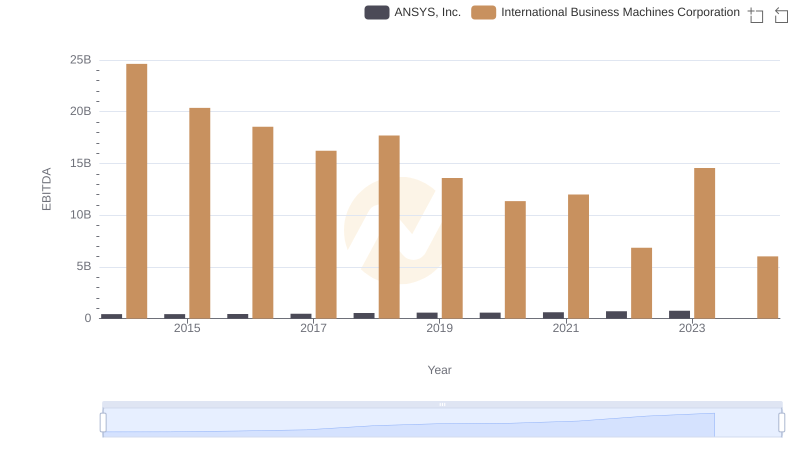
Comparative EBITDA Analysis: International Business Machines Corporation vs ANSYS, Inc.