| __timestamp | ANSYS, Inc. | International Business Machines Corporation |
|---|---|---|
| Wednesday, January 1, 2014 | 936021000 | 92793000000 |
| Thursday, January 1, 2015 | 942753000 | 81742000000 |
| Friday, January 1, 2016 | 988465000 | 79920000000 |
| Sunday, January 1, 2017 | 1095250000 | 79139000000 |
| Monday, January 1, 2018 | 1293636000 | 79591000000 |
| Tuesday, January 1, 2019 | 1515892000 | 57714000000 |
| Wednesday, January 1, 2020 | 1681297000 | 55179000000 |
| Friday, January 1, 2021 | 1906715000 | 57351000000 |
| Saturday, January 1, 2022 | 2065553000 | 60530000000 |
| Sunday, January 1, 2023 | 2269949000 | 61860000000 |
| Monday, January 1, 2024 | 2544809000 | 62753000000 |
Cracking the code
In the ever-evolving landscape of technology, the financial trajectories of industry giants like International Business Machines Corporation (IBM) and ANSYS, Inc. offer a fascinating glimpse into market dynamics. Over the past decade, IBM's revenue has seen a notable decline, dropping from a peak in 2014 to a 33% decrease by 2021. This trend reflects the company's strategic pivot towards cloud computing and AI, which may have initially impacted traditional revenue streams.
Conversely, ANSYS, Inc. has experienced a robust growth trajectory, with revenues more than doubling from 2014 to 2023. This 142% increase underscores ANSYS's stronghold in simulation software, a sector increasingly vital for innovation across industries.
While IBM's revenue showed signs of recovery post-2021, ANSYS's consistent upward trend highlights its resilience and adaptability. Missing data for 2024 suggests ongoing developments, making this an exciting space to watch.
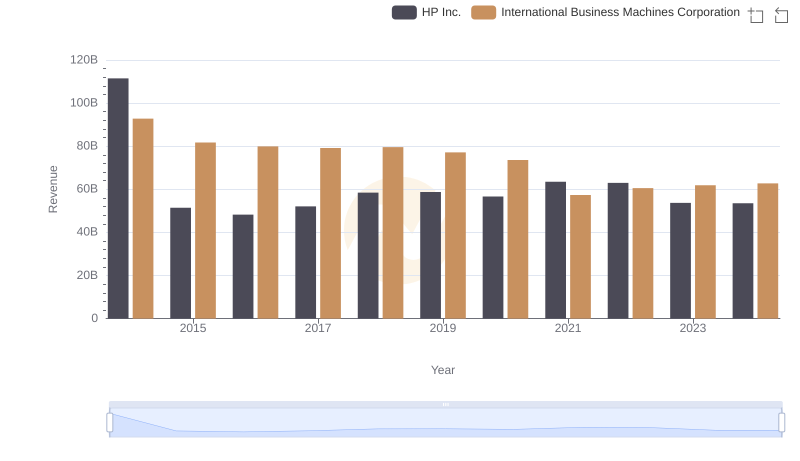
International Business Machines Corporation and HP Inc.: A Comprehensive Revenue Analysis
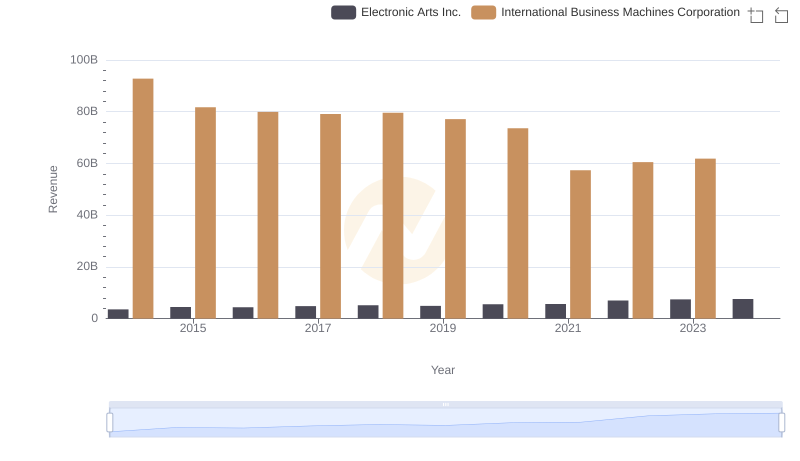
Comparing Revenue Performance: International Business Machines Corporation or Electronic Arts Inc.?
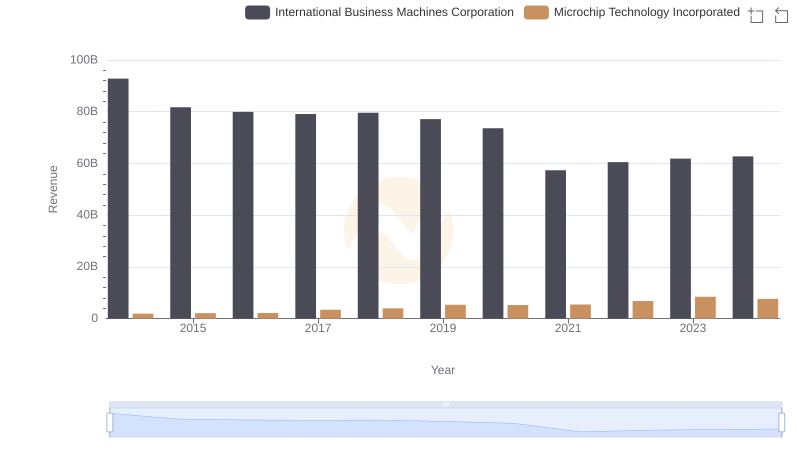
Annual Revenue Comparison: International Business Machines Corporation vs Microchip Technology Incorporated
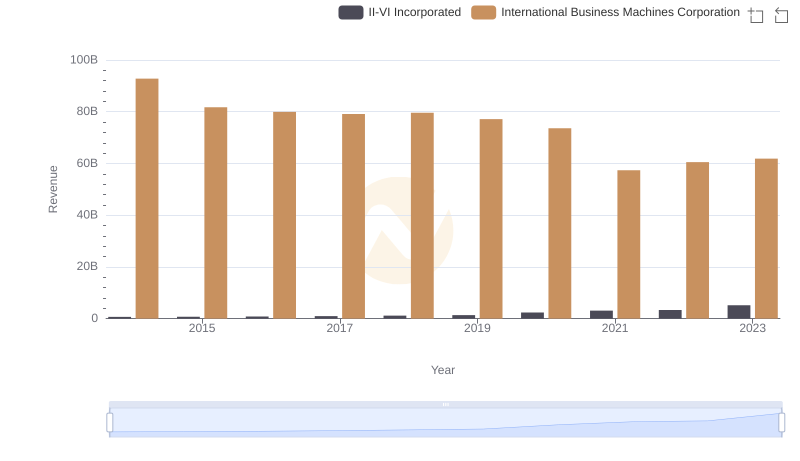
Breaking Down Revenue Trends: International Business Machines Corporation vs II-VI Incorporated
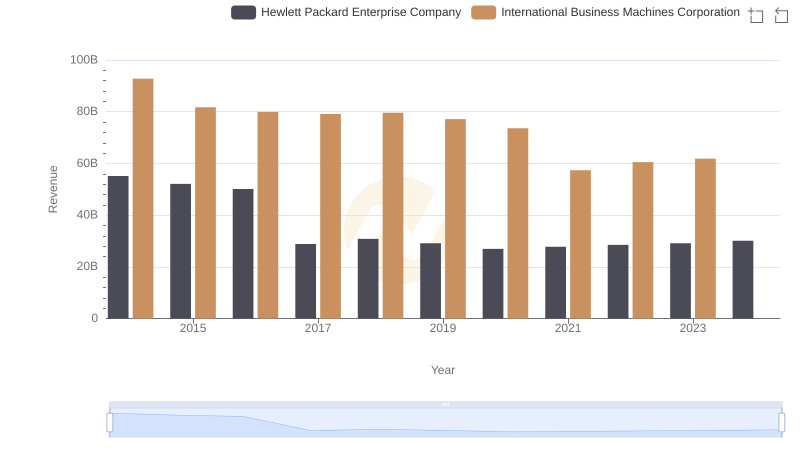
Who Generates More Revenue? International Business Machines Corporation or Hewlett Packard Enterprise Company
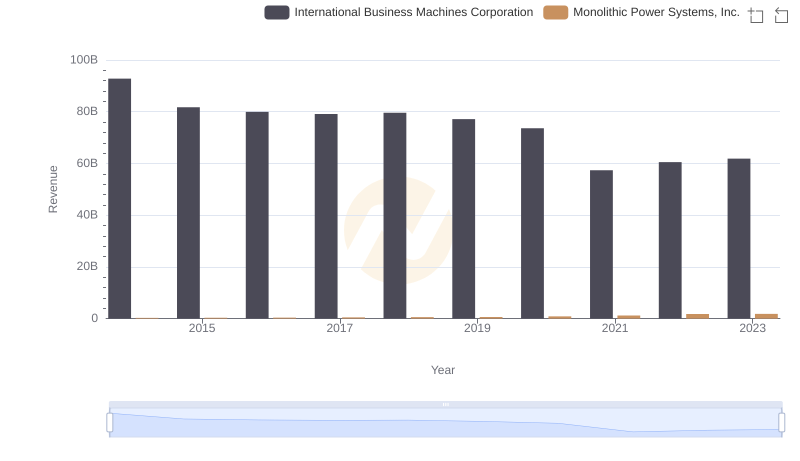
International Business Machines Corporation vs Monolithic Power Systems, Inc.: Examining Key Revenue Metrics
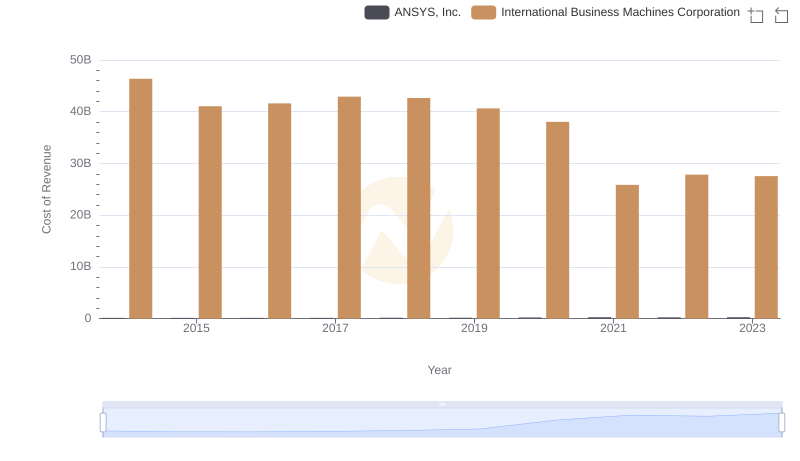
Cost of Revenue: Key Insights for International Business Machines Corporation and ANSYS, Inc.
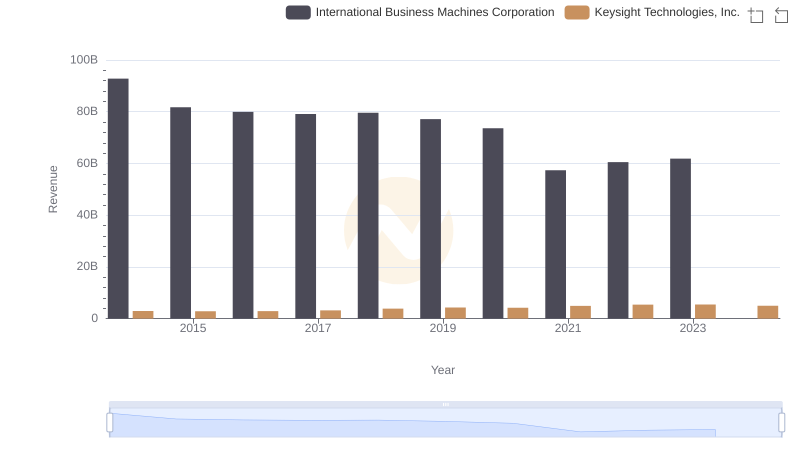
International Business Machines Corporation or Keysight Technologies, Inc.: Who Leads in Yearly Revenue?
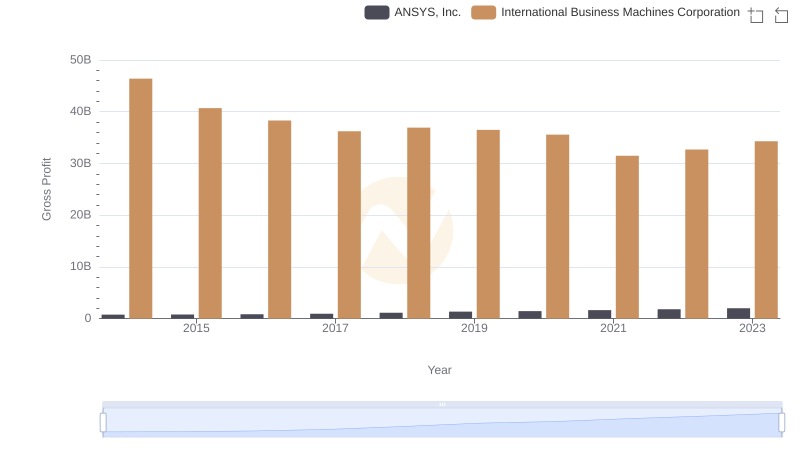
Gross Profit Comparison: International Business Machines Corporation and ANSYS, Inc. Trends
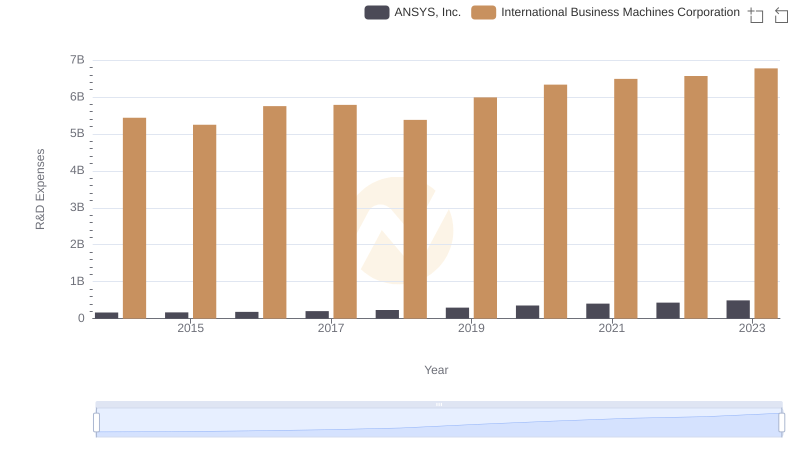
International Business Machines Corporation or ANSYS, Inc.: Who Invests More in Innovation?
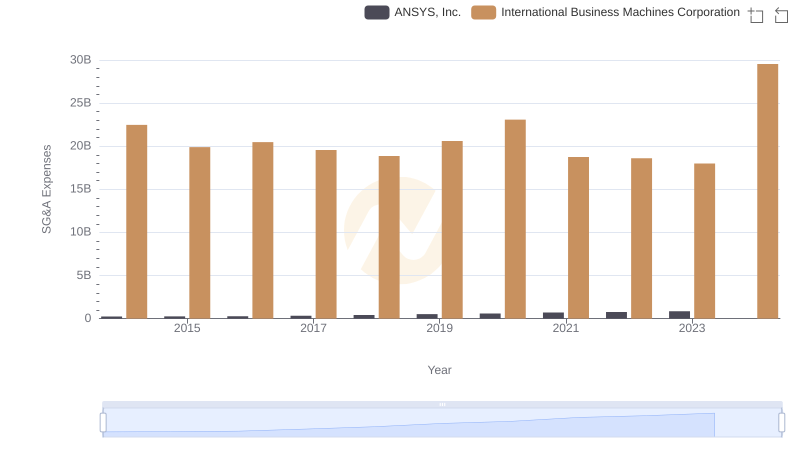
Comparing SG&A Expenses: International Business Machines Corporation vs ANSYS, Inc. Trends and Insights
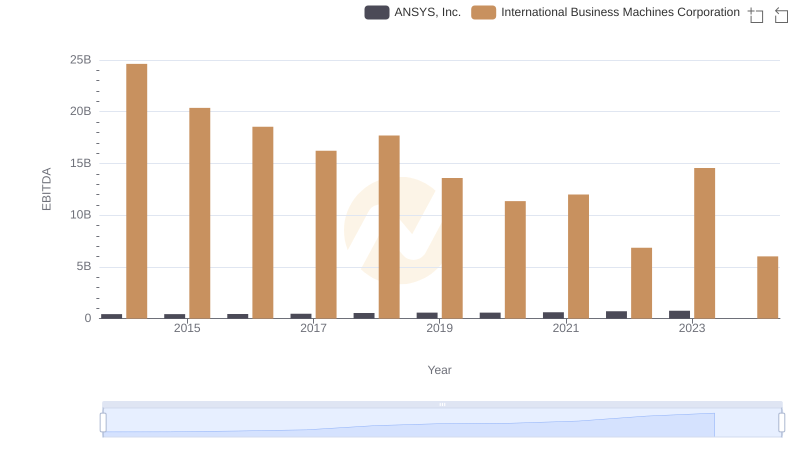
Comparative EBITDA Analysis: International Business Machines Corporation vs ANSYS, Inc.