| __timestamp | Electronic Arts Inc. | International Business Machines Corporation |
|---|---|---|
| Wednesday, January 1, 2014 | 1347000000 | 46386000000 |
| Thursday, January 1, 2015 | 1429000000 | 41057000000 |
| Friday, January 1, 2016 | 1354000000 | 41403000000 |
| Sunday, January 1, 2017 | 1298000000 | 42196000000 |
| Monday, January 1, 2018 | 1277000000 | 42655000000 |
| Tuesday, January 1, 2019 | 1322000000 | 26181000000 |
| Wednesday, January 1, 2020 | 1369000000 | 24314000000 |
| Friday, January 1, 2021 | 1494000000 | 25865000000 |
| Saturday, January 1, 2022 | 1859000000 | 27842000000 |
| Sunday, January 1, 2023 | 1792000000 | 27560000000 |
| Monday, January 1, 2024 | 1710000000 | 27202000000 |
Unlocking the unknown
In the ever-evolving landscape of technology and entertainment, cost efficiency remains a pivotal factor for success. This chart offers a fascinating glimpse into the cost of revenue trends for International Business Machines Corporation (IBM) and Electronic Arts Inc. (EA) from 2014 to 2024. Over this decade, IBM's cost of revenue has seen a significant decline, dropping by approximately 41% from its peak in 2014. In contrast, EA's cost of revenue has shown a more stable trajectory, with a modest increase of around 27% over the same period.
This divergence highlights the distinct operational strategies of these two industry leaders. While IBM has been streamlining its operations, EA has been investing in its gaming portfolio. As we look to the future, understanding these trends can provide valuable insights into the strategic directions of these companies.
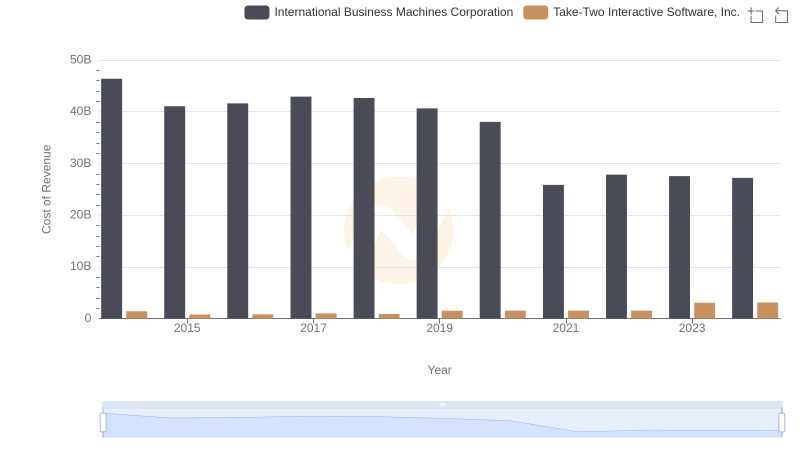
Cost of Revenue: Key Insights for International Business Machines Corporation and Take-Two Interactive Software, Inc.
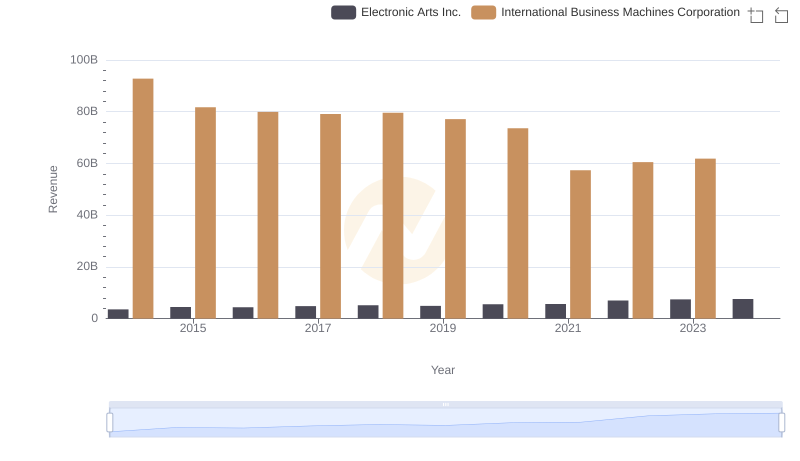
Comparing Revenue Performance: International Business Machines Corporation or Electronic Arts Inc.?
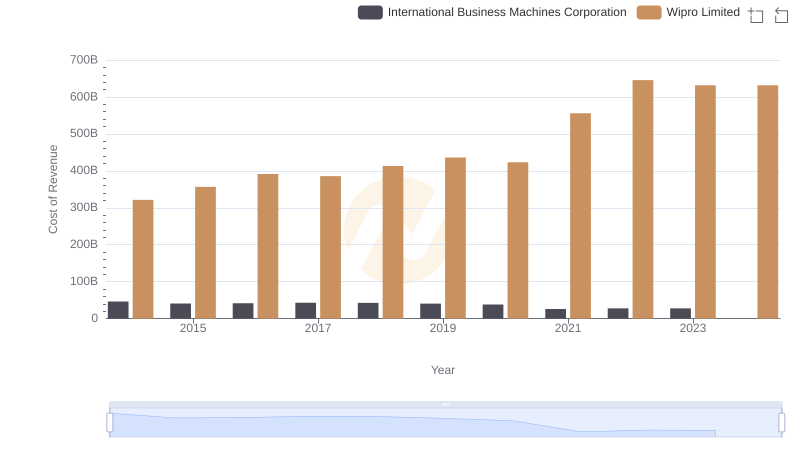
Analyzing Cost of Revenue: International Business Machines Corporation and Wipro Limited
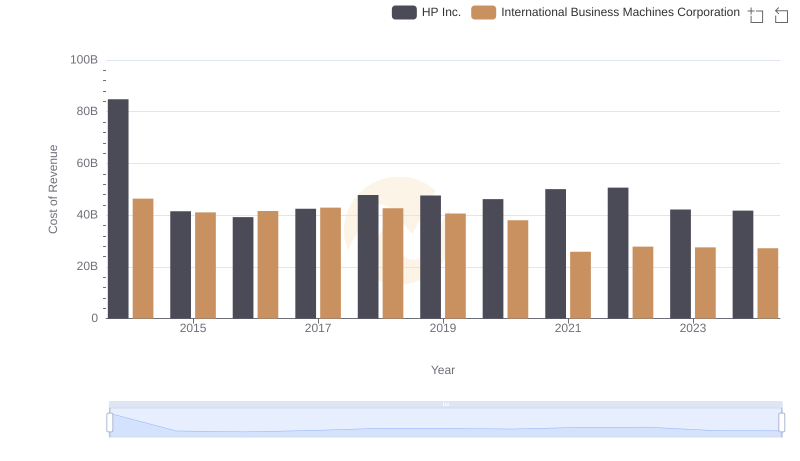
Cost of Revenue: Key Insights for International Business Machines Corporation and HP Inc.

Comparing Cost of Revenue Efficiency: International Business Machines Corporation vs Microchip Technology Incorporated
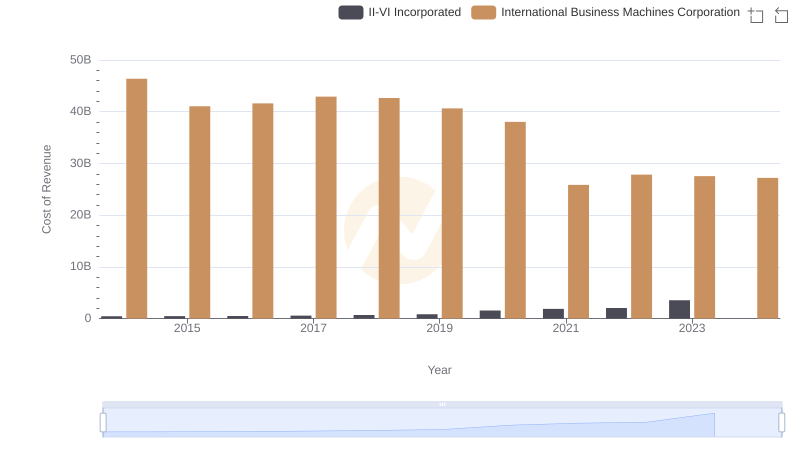
Analyzing Cost of Revenue: International Business Machines Corporation and II-VI Incorporated
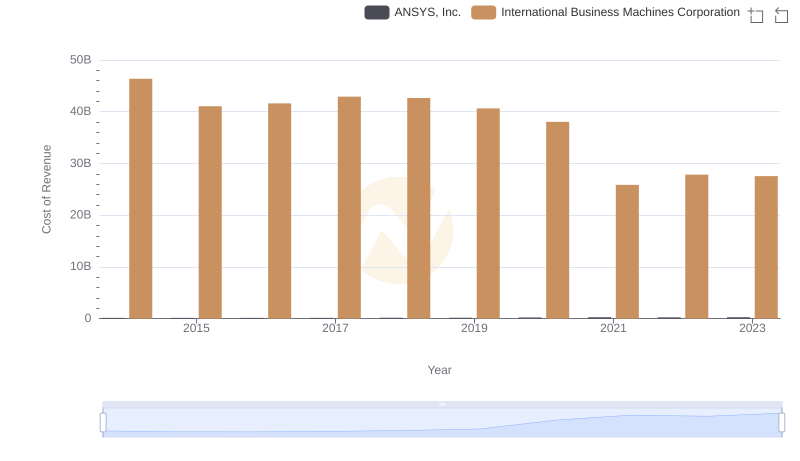
Cost of Revenue: Key Insights for International Business Machines Corporation and ANSYS, Inc.
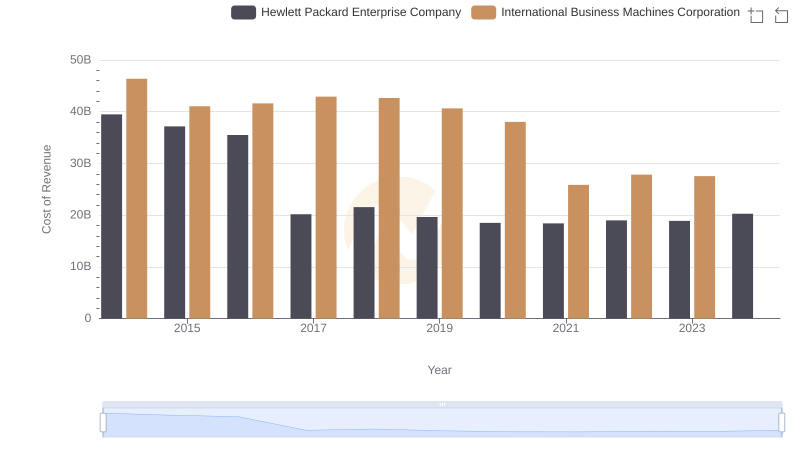
Analyzing Cost of Revenue: International Business Machines Corporation and Hewlett Packard Enterprise Company
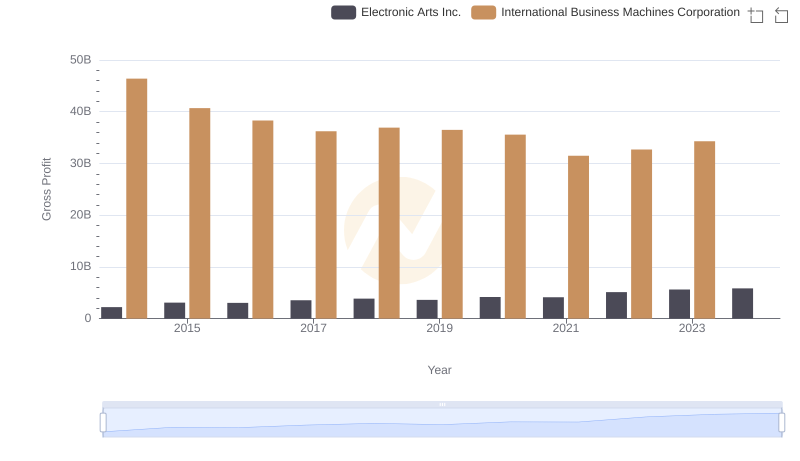
International Business Machines Corporation vs Electronic Arts Inc.: A Gross Profit Performance Breakdown
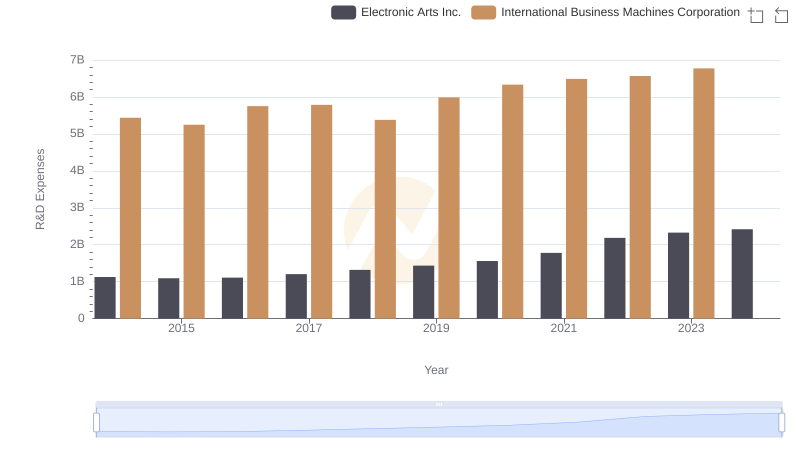
Analyzing R&D Budgets: International Business Machines Corporation vs Electronic Arts Inc.
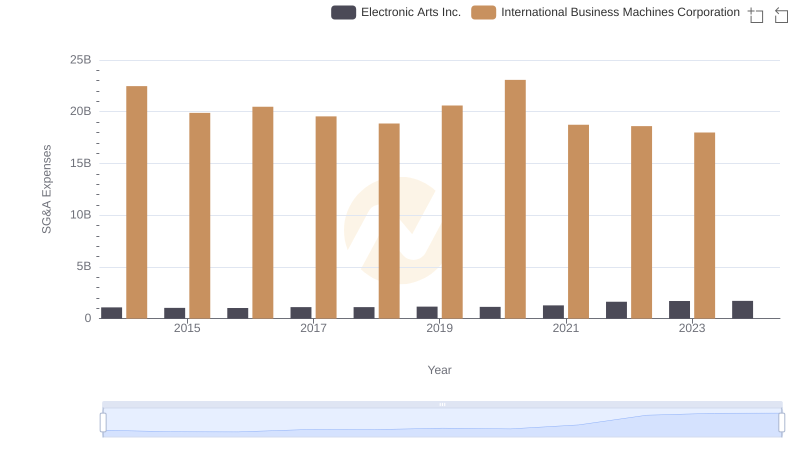
International Business Machines Corporation or Electronic Arts Inc.: Who Manages SG&A Costs Better?
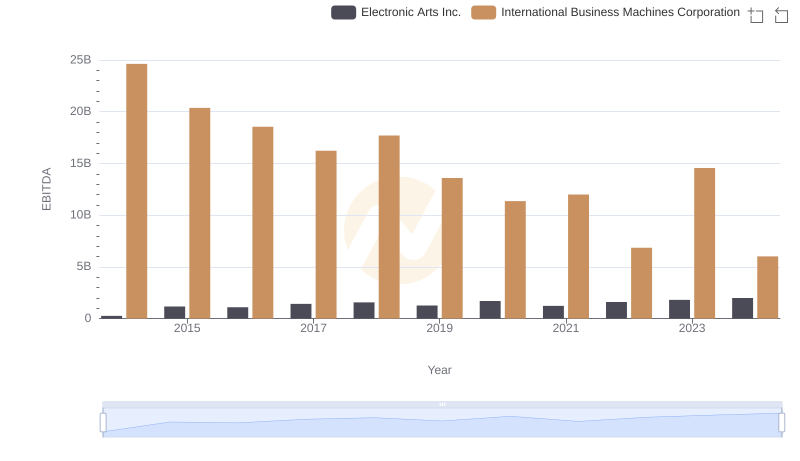
EBITDA Performance Review: International Business Machines Corporation vs Electronic Arts Inc.