| __timestamp | Clean Harbors, Inc. | Ingersoll Rand Inc. |
|---|---|---|
| Wednesday, January 1, 2014 | 3401636000 | 2570005000 |
| Thursday, January 1, 2015 | 3275137000 | 2126900000 |
| Friday, January 1, 2016 | 2755226000 | 1939436000 |
| Sunday, January 1, 2017 | 2944978000 | 2375400000 |
| Monday, January 1, 2018 | 3300303000 | 2689800000 |
| Tuesday, January 1, 2019 | 3412190000 | 2451900000 |
| Wednesday, January 1, 2020 | 3144097000 | 4910200000 |
| Friday, January 1, 2021 | 3805566000 | 5152400000 |
| Saturday, January 1, 2022 | 5166605000 | 5916300000 |
| Sunday, January 1, 2023 | 5409152000 | 6876100000 |
| Monday, January 1, 2024 | 5889952000 | 0 |
In pursuit of knowledge
In the ever-evolving landscape of industrial and environmental services, revenue performance is a key indicator of success. Over the past decade, Ingersoll Rand Inc. and Clean Harbors, Inc. have been at the forefront of this competition. From 2014 to 2023, Clean Harbors, Inc. saw a steady revenue growth, culminating in a 60% increase by 2023. Meanwhile, Ingersoll Rand Inc. experienced a remarkable surge, with revenues nearly tripling, peaking in 2023.
The year 2020 marked a pivotal point for Ingersoll Rand, with revenues jumping by 100% compared to the previous year, a testament to their strategic initiatives. Clean Harbors, while consistent, saw its most significant growth in 2022, with a 35% increase. This data not only highlights the resilience of these companies but also underscores the dynamic nature of the industry. As we look to the future, these trends offer valuable insights into the competitive strategies shaping the market.
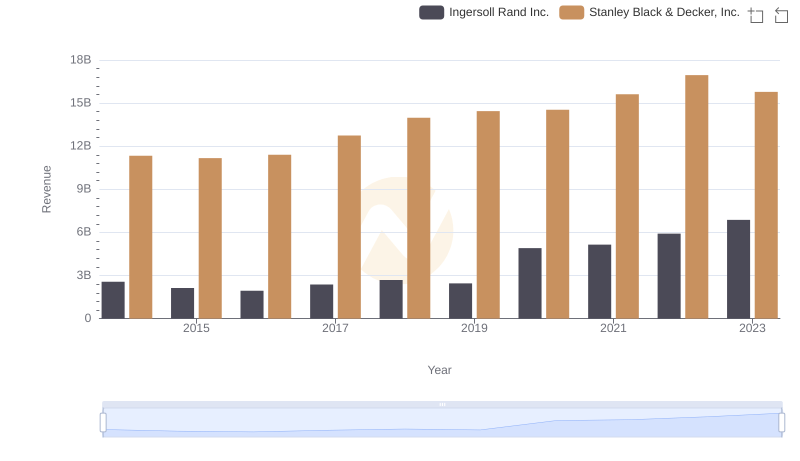
Ingersoll Rand Inc. or Stanley Black & Decker, Inc.: Who Leads in Yearly Revenue?
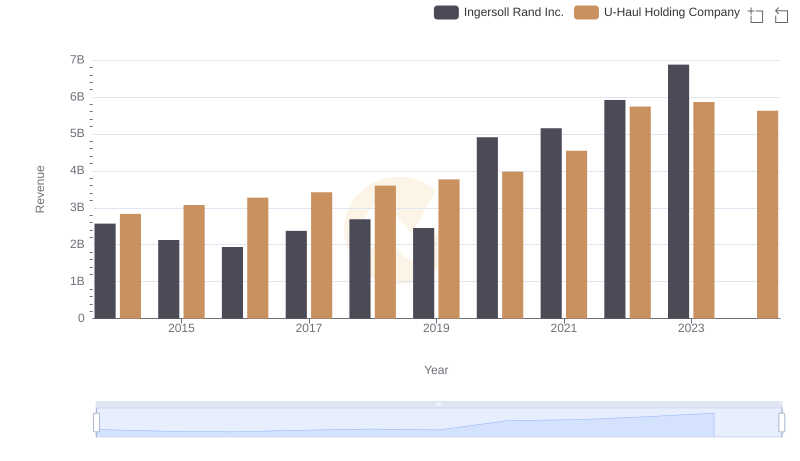
Revenue Showdown: Ingersoll Rand Inc. vs U-Haul Holding Company
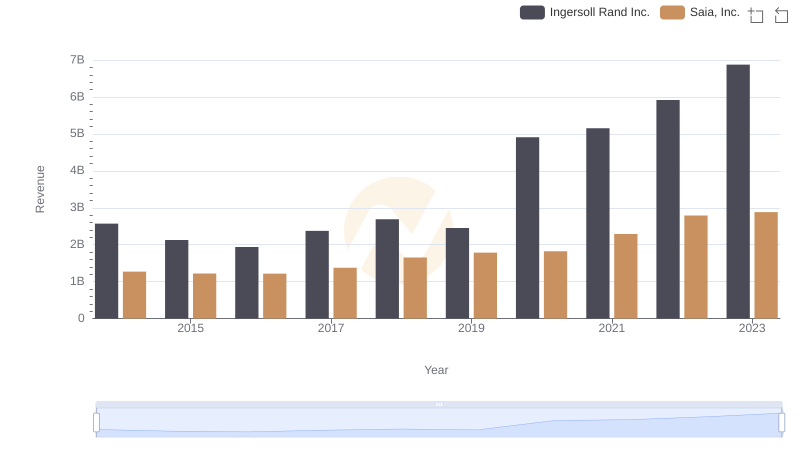
Ingersoll Rand Inc. and Saia, Inc.: A Comprehensive Revenue Analysis
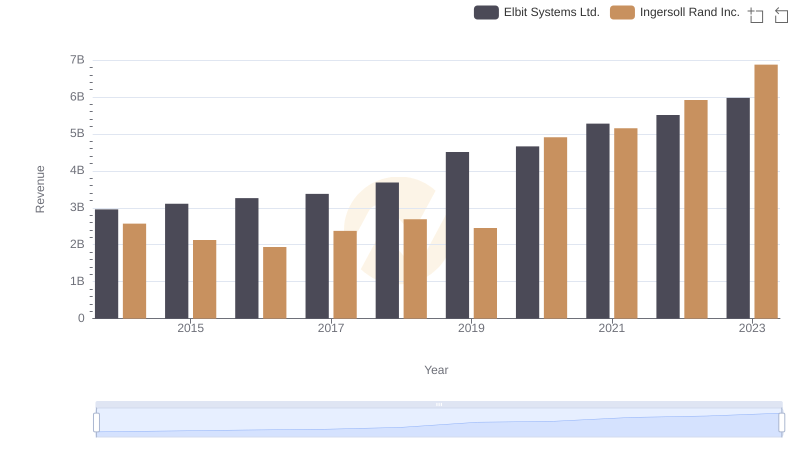
Comparing Revenue Performance: Ingersoll Rand Inc. or Elbit Systems Ltd.?
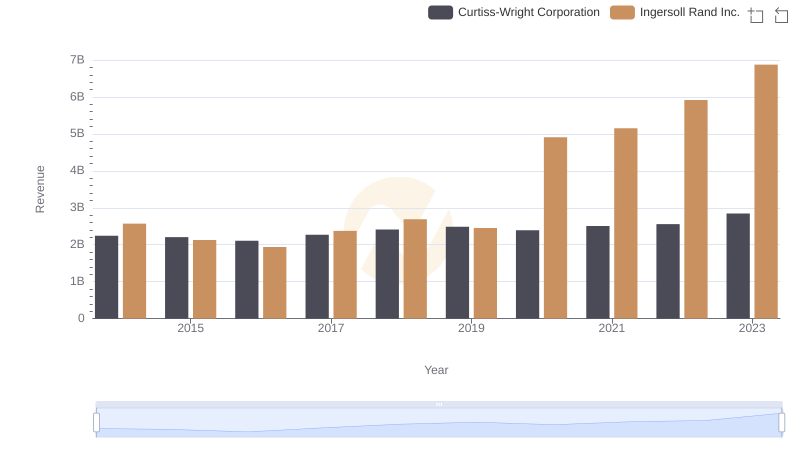
Ingersoll Rand Inc. or Curtiss-Wright Corporation: Who Leads in Yearly Revenue?
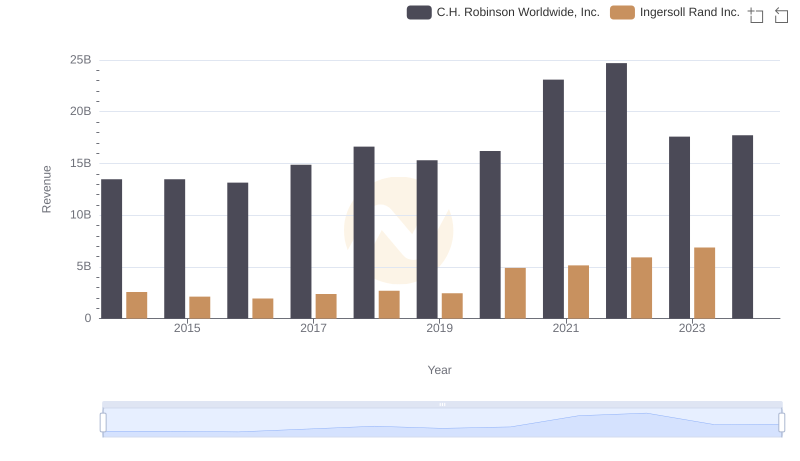
Comparing Revenue Performance: Ingersoll Rand Inc. or C.H. Robinson Worldwide, Inc.?
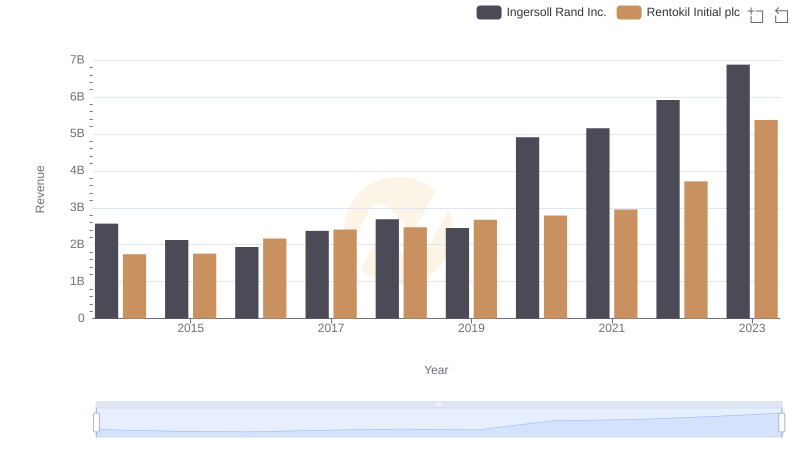
Comparing Revenue Performance: Ingersoll Rand Inc. or Rentokil Initial plc?
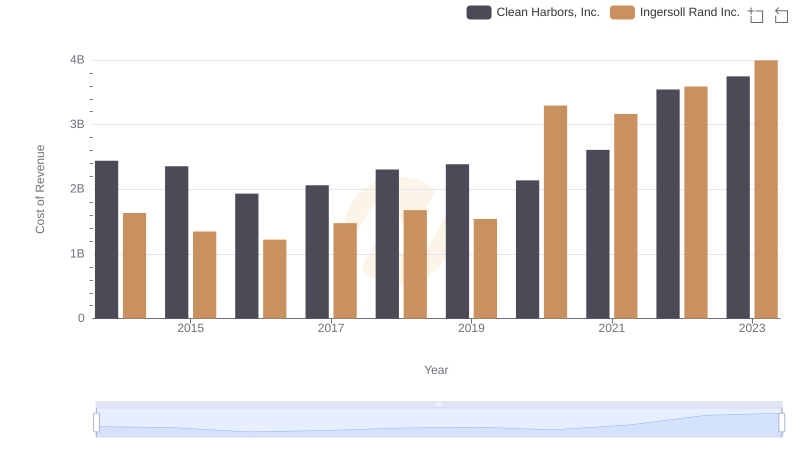
Cost of Revenue: Key Insights for Ingersoll Rand Inc. and Clean Harbors, Inc.
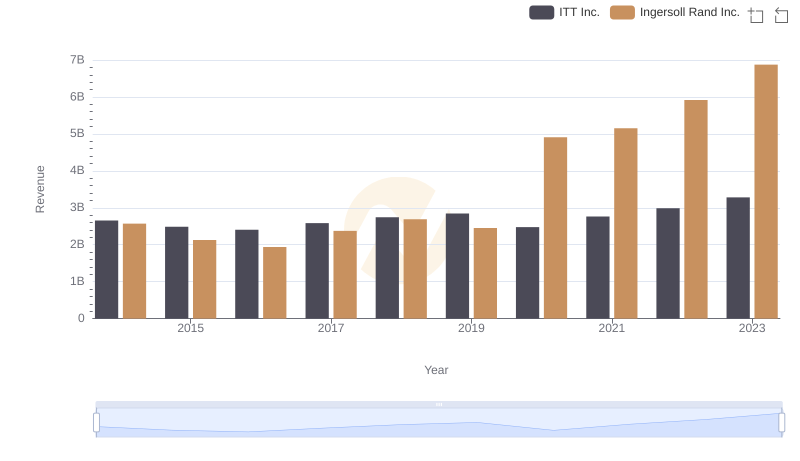
Ingersoll Rand Inc. or ITT Inc.: Who Leads in Yearly Revenue?
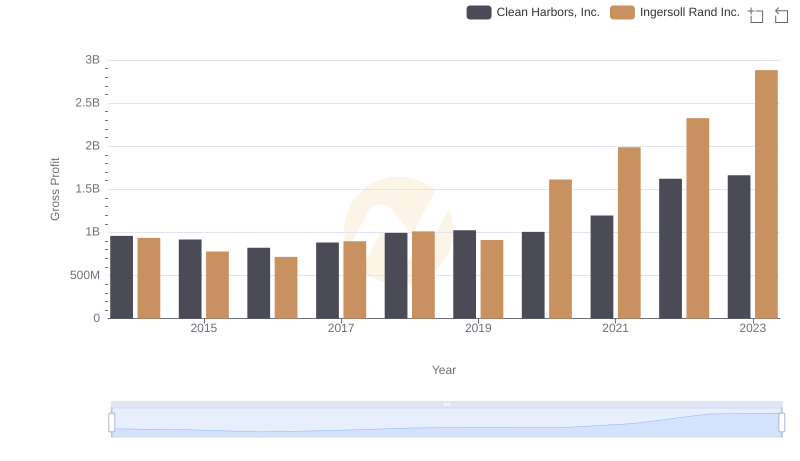
Who Generates Higher Gross Profit? Ingersoll Rand Inc. or Clean Harbors, Inc.
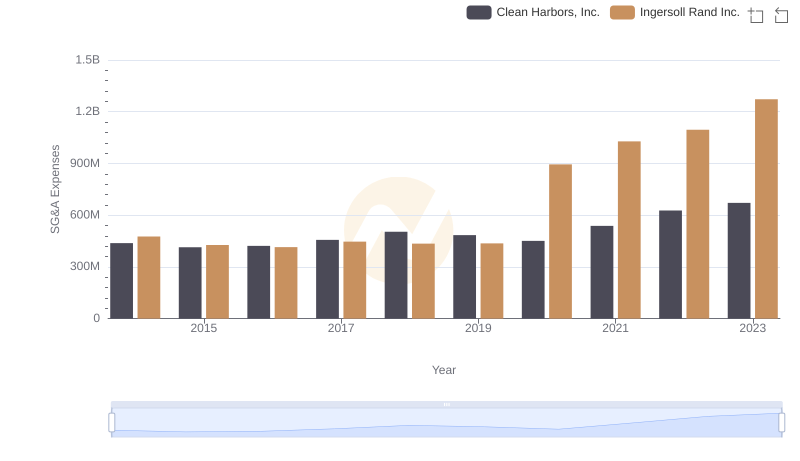
Ingersoll Rand Inc. vs Clean Harbors, Inc.: SG&A Expense Trends