| __timestamp | Cisco Systems, Inc. | Telefonaktiebolaget LM Ericsson (publ) |
|---|---|---|
| Wednesday, January 1, 2014 | 11437000000 | 27100000000 |
| Thursday, January 1, 2015 | 11861000000 | 29285000000 |
| Friday, January 1, 2016 | 11433000000 | 28866000000 |
| Sunday, January 1, 2017 | 11177000000 | 32676000000 |
| Monday, January 1, 2018 | 11386000000 | 27519000000 |
| Tuesday, January 1, 2019 | 11398000000 | 26137000000 |
| Wednesday, January 1, 2020 | 11094000000 | 26684000000 |
| Friday, January 1, 2021 | 11411000000 | 26957000000 |
| Saturday, January 1, 2022 | 11186000000 | 35692000000 |
| Sunday, January 1, 2023 | 12358000000 | 37682000000 |
| Monday, January 1, 2024 | 13177000000 |
Unleashing the power of data
In the ever-evolving tech industry, operational efficiency is key to maintaining a competitive edge. This analysis delves into the Selling, General, and Administrative (SG&A) expenses of two tech giants: Cisco Systems, Inc. and Telefonaktiebolaget LM Ericsson (publ), from 2014 to 2023.
Cisco's SG&A expenses have shown a steady trend, with a notable increase of approximately 15% from 2014 to 2023. In contrast, Ericsson's expenses have been more volatile, peaking in 2023 with a 39% increase compared to 2014. This fluctuation could be attributed to strategic shifts or market challenges faced by Ericsson.
Interestingly, the data for 2024 is incomplete, highlighting the dynamic nature of financial reporting. As these companies navigate the complexities of the global market, understanding their operational costs provides valuable insights into their strategic priorities and financial health.

Cisco Systems, Inc. vs Telefonaktiebolaget LM Ericsson (publ): Examining Key Revenue Metrics
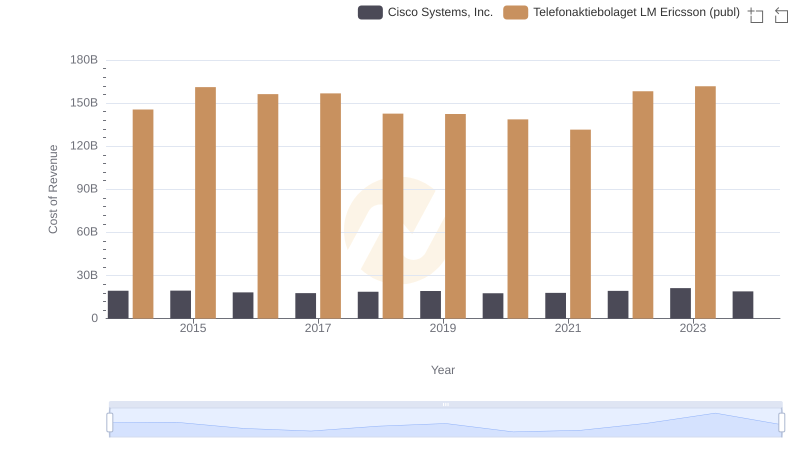
Cost of Revenue: Key Insights for Cisco Systems, Inc. and Telefonaktiebolaget LM Ericsson (publ)
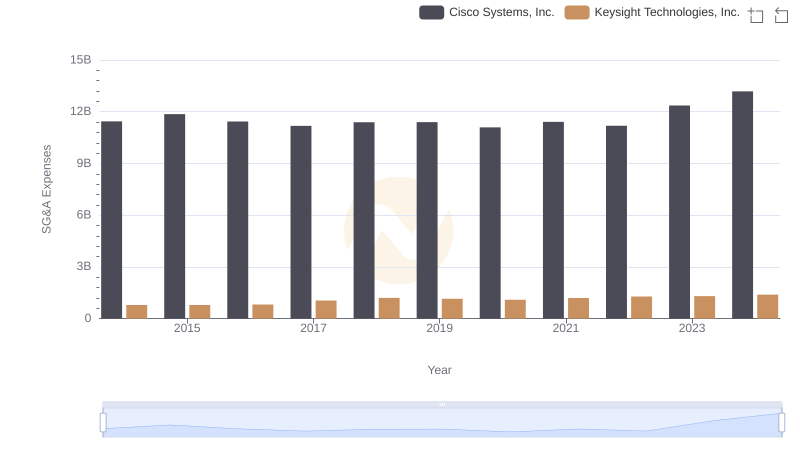
Cost Management Insights: SG&A Expenses for Cisco Systems, Inc. and Keysight Technologies, Inc.
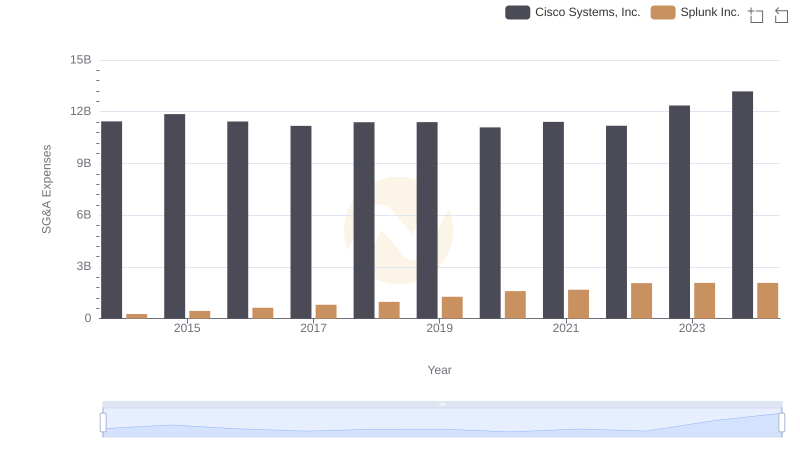
Comparing SG&A Expenses: Cisco Systems, Inc. vs Splunk Inc. Trends and Insights
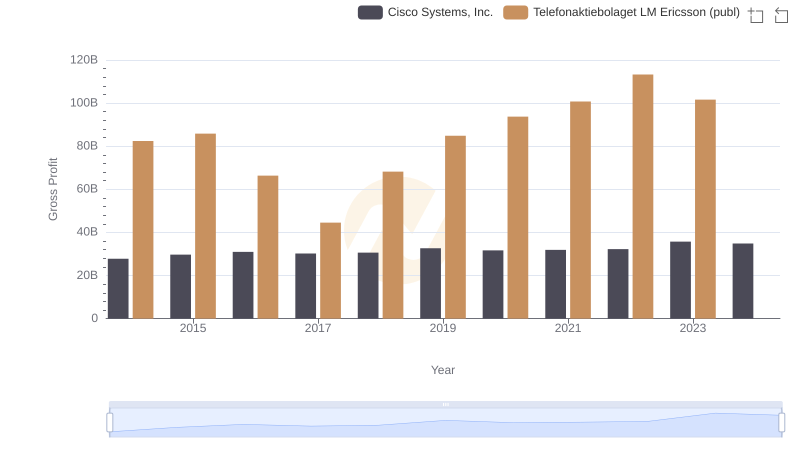
Cisco Systems, Inc. vs Telefonaktiebolaget LM Ericsson (publ): A Gross Profit Performance Breakdown
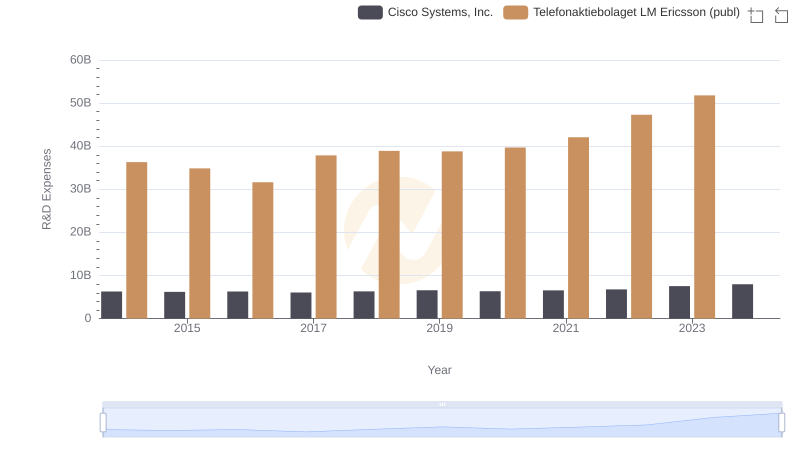
Research and Development: Comparing Key Metrics for Cisco Systems, Inc. and Telefonaktiebolaget LM Ericsson (publ)
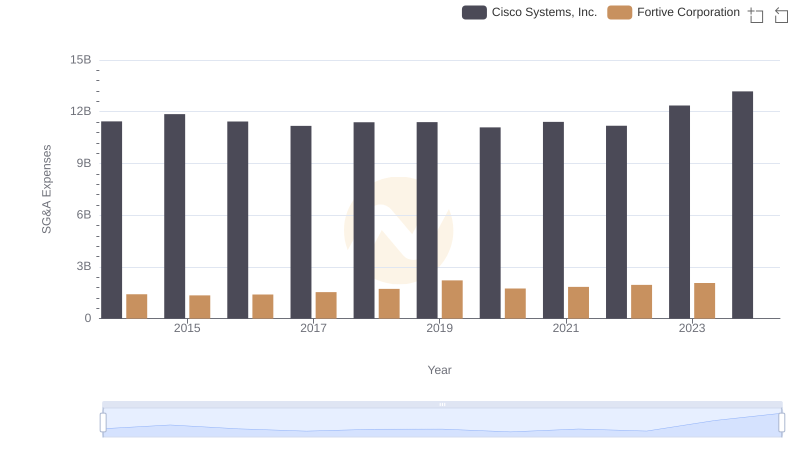
Operational Costs Compared: SG&A Analysis of Cisco Systems, Inc. and Fortive Corporation
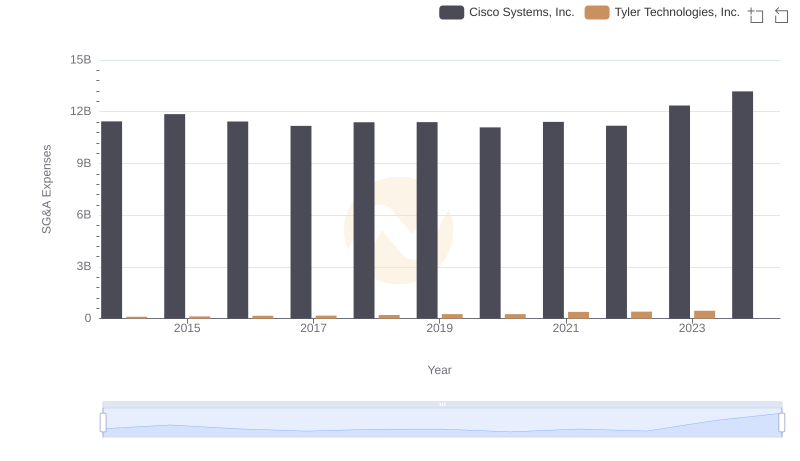
Breaking Down SG&A Expenses: Cisco Systems, Inc. vs Tyler Technologies, Inc.
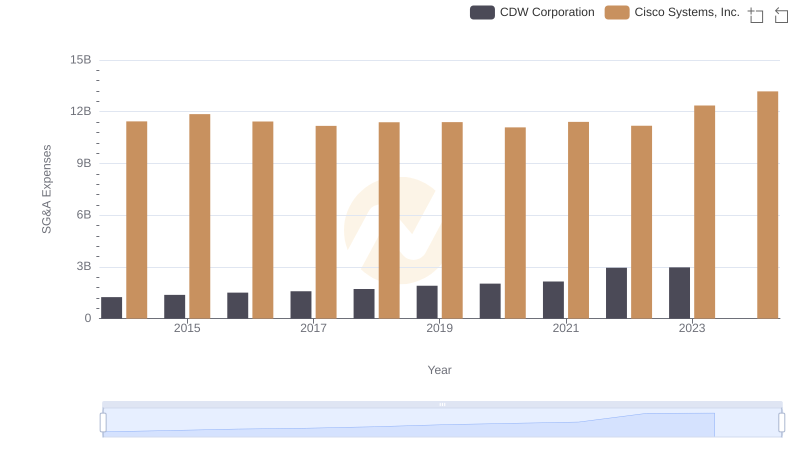
Cisco Systems, Inc. or CDW Corporation: Who Manages SG&A Costs Better?
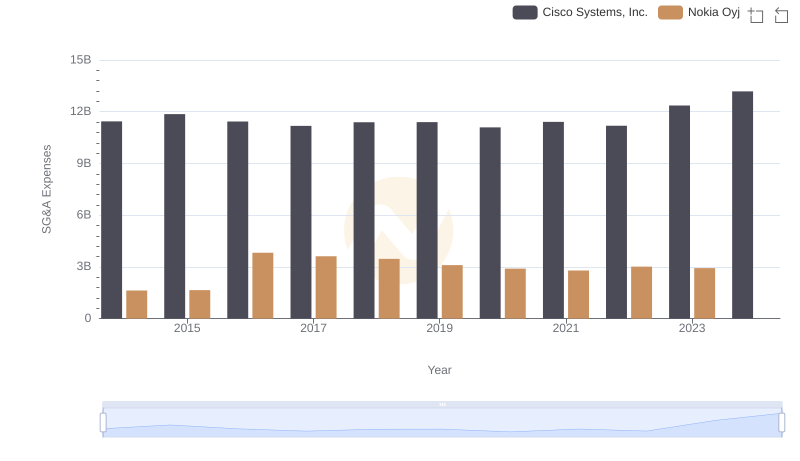
Cisco Systems, Inc. or Nokia Oyj: Who Manages SG&A Costs Better?
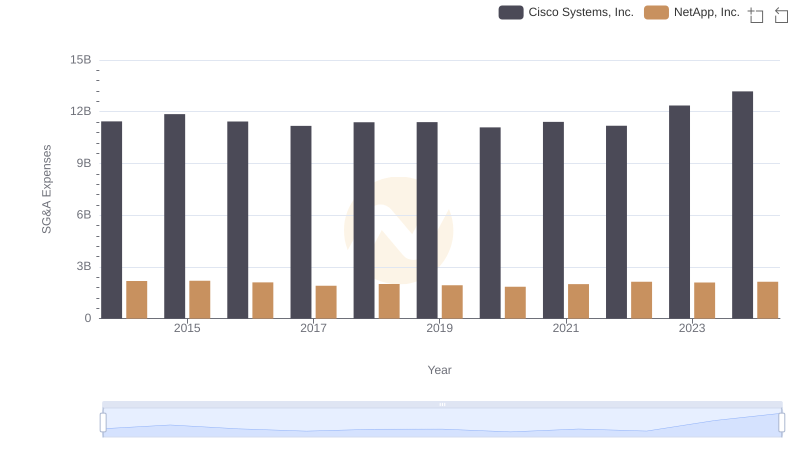
Cost Management Insights: SG&A Expenses for Cisco Systems, Inc. and NetApp, Inc.
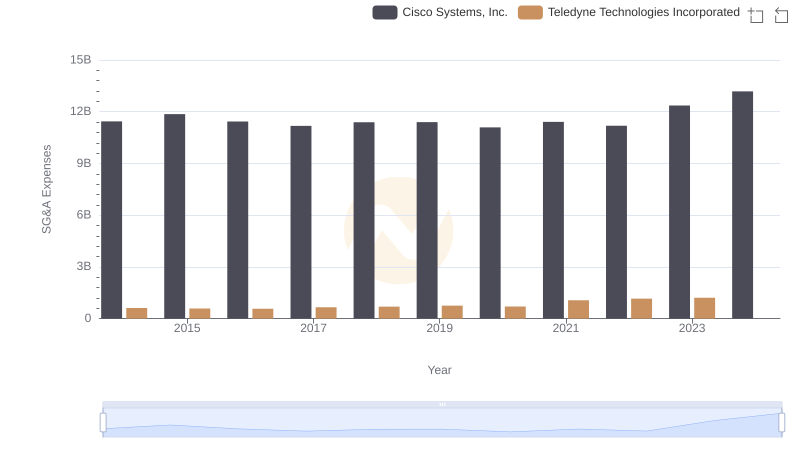
Operational Costs Compared: SG&A Analysis of Cisco Systems, Inc. and Teledyne Technologies Incorporated