| __timestamp | CNH Industrial N.V. | Cintas Corporation |
|---|---|---|
| Wednesday, January 1, 2014 | 32555000000 | 4551812000 |
| Thursday, January 1, 2015 | 25912000000 | 4476886000 |
| Friday, January 1, 2016 | 24872000000 | 4905458000 |
| Sunday, January 1, 2017 | 27361000000 | 5323381000 |
| Monday, January 1, 2018 | 29706000000 | 6476632000 |
| Tuesday, January 1, 2019 | 28079000000 | 6892303000 |
| Wednesday, January 1, 2020 | 26032000000 | 7085120000 |
| Friday, January 1, 2021 | 33428000000 | 7116340000 |
| Saturday, January 1, 2022 | 23551000000 | 7854459000 |
| Sunday, January 1, 2023 | 24694000000 | 8815769000 |
| Monday, January 1, 2024 | 9596615000 |
Unleashing the power of data
In the ever-evolving landscape of global business, Cintas Corporation and CNH Industrial N.V. stand as titans in their respective industries. Over the past decade, these companies have showcased remarkable resilience and growth. From 2014 to 2023, CNH Industrial N.V. experienced fluctuations in revenue, peaking in 2021 with a 34% increase from its lowest point in 2022. Meanwhile, Cintas Corporation demonstrated consistent growth, with revenue surging by nearly 94% from 2014 to 2023. This steady ascent highlights Cintas's strategic prowess in navigating market challenges. Notably, 2024 data for CNH Industrial is missing, leaving room for speculation on its future trajectory. As these companies continue to adapt and innovate, their financial journeys offer valuable insights into the dynamics of global commerce.
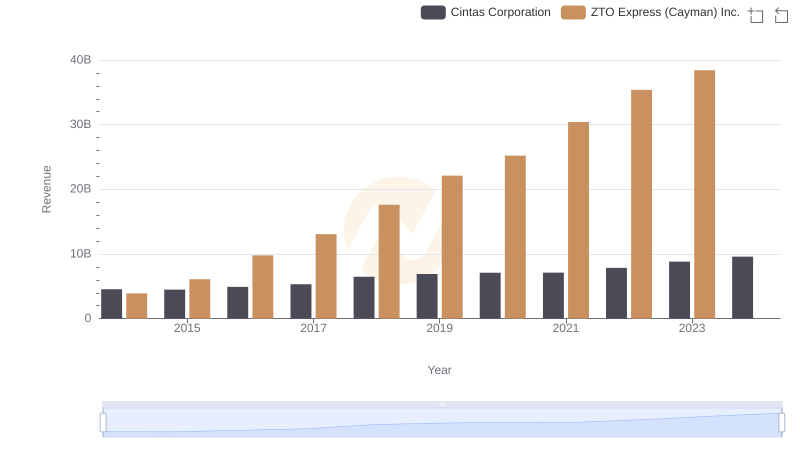
Annual Revenue Comparison: Cintas Corporation vs ZTO Express (Cayman) Inc.
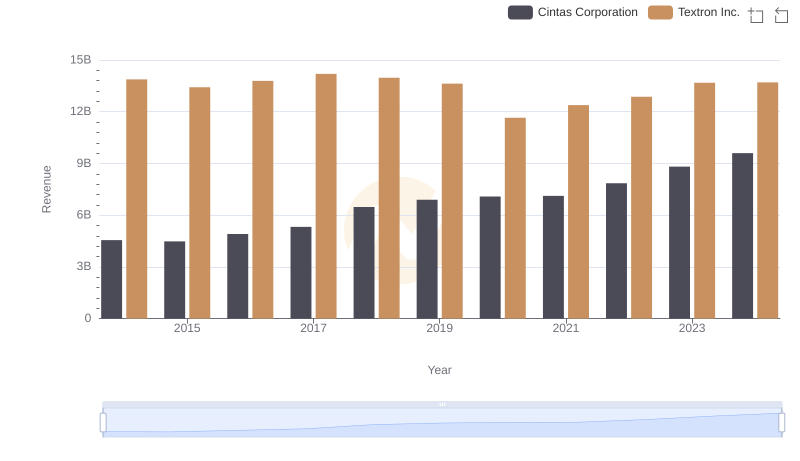
Cintas Corporation vs Textron Inc.: Annual Revenue Growth Compared
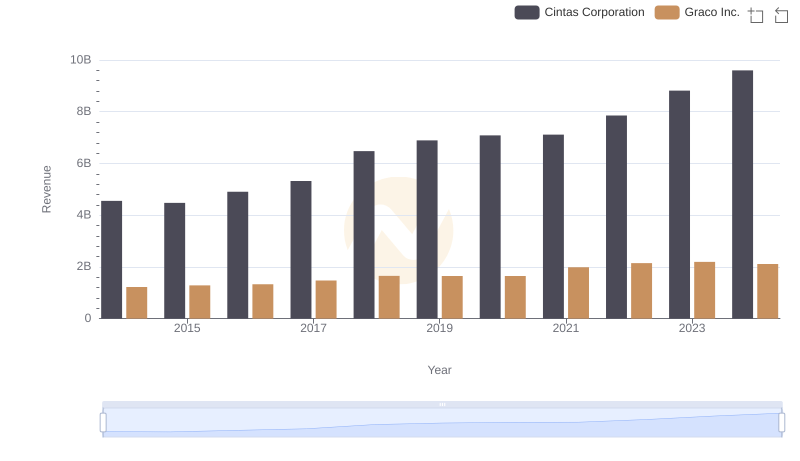
Cintas Corporation and Graco Inc.: A Comprehensive Revenue Analysis
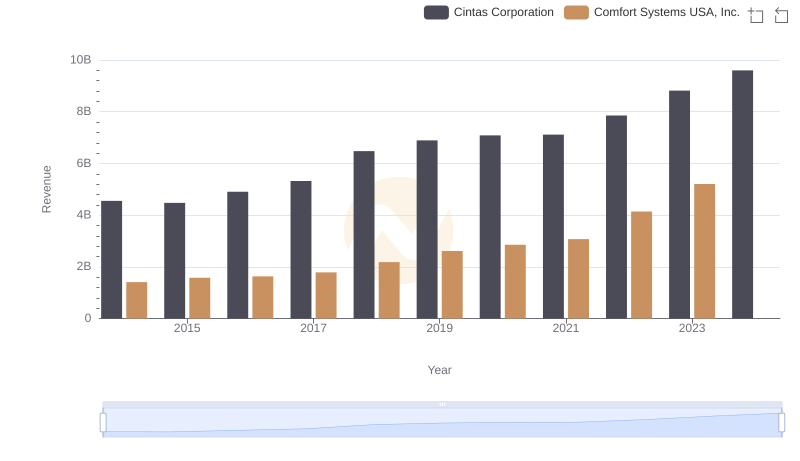
Cintas Corporation and Comfort Systems USA, Inc.: A Comprehensive Revenue Analysis
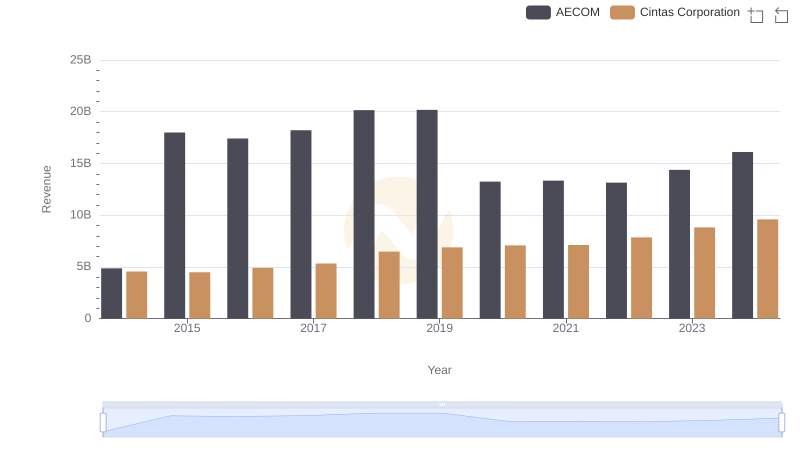
Breaking Down Revenue Trends: Cintas Corporation vs AECOM
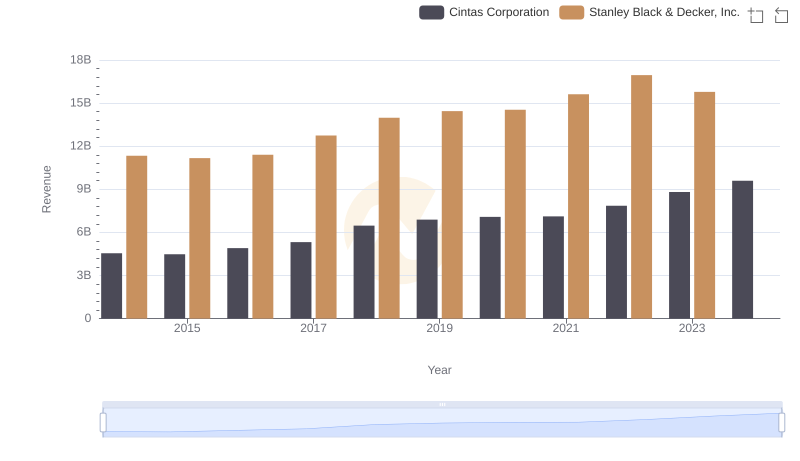
Breaking Down Revenue Trends: Cintas Corporation vs Stanley Black & Decker, Inc.
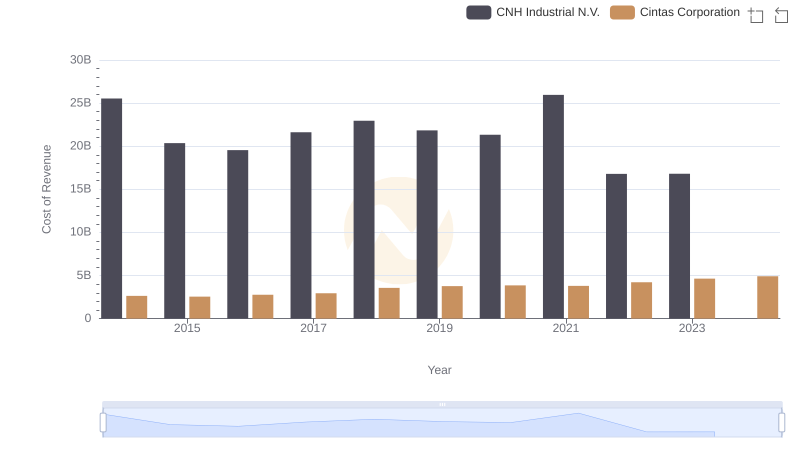
Cost of Revenue: Key Insights for Cintas Corporation and CNH Industrial N.V.
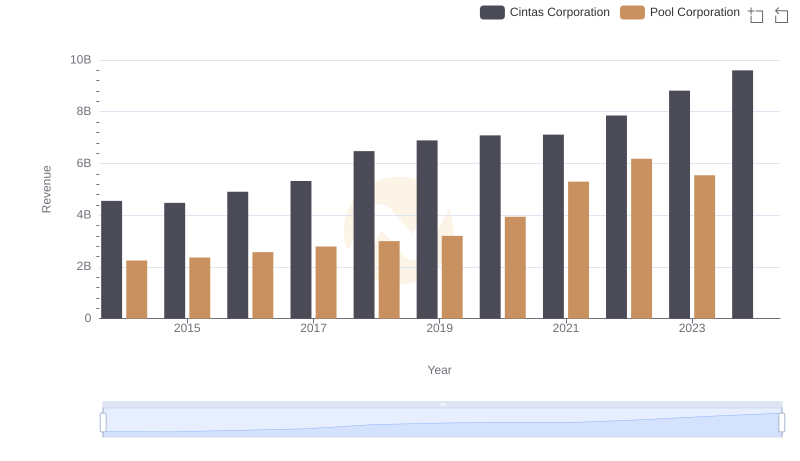
Who Generates More Revenue? Cintas Corporation or Pool Corporation
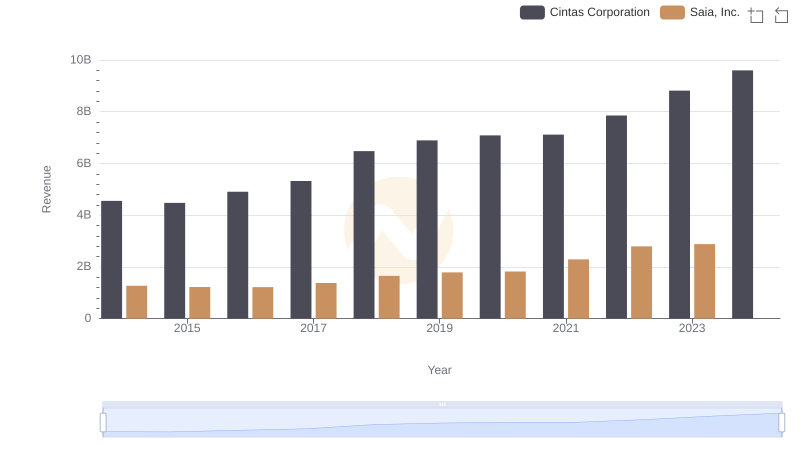
Cintas Corporation vs Saia, Inc.: Examining Key Revenue Metrics
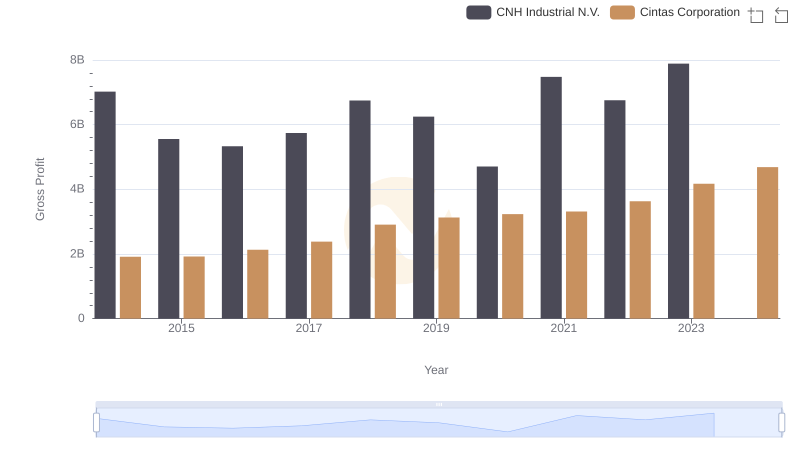
Who Generates Higher Gross Profit? Cintas Corporation or CNH Industrial N.V.
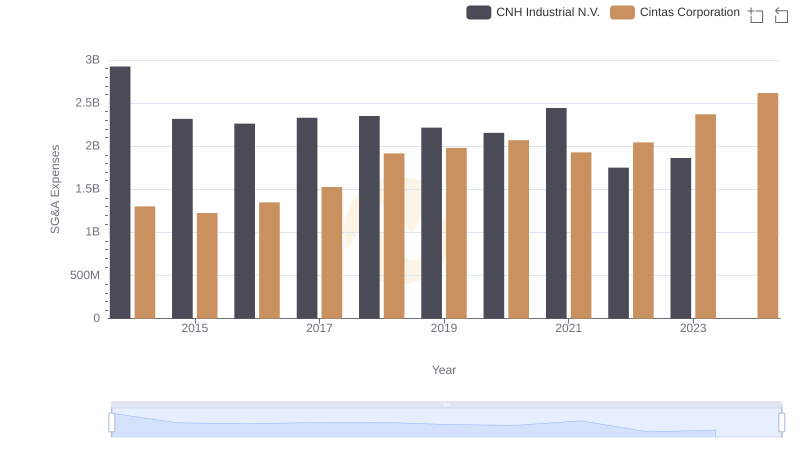
Cintas Corporation or CNH Industrial N.V.: Who Manages SG&A Costs Better?