| __timestamp | Stanley Black & Decker, Inc. | Westinghouse Air Brake Technologies Corporation |
|---|---|---|
| Wednesday, January 1, 2014 | 7235900000 | 2130920000 |
| Thursday, January 1, 2015 | 7099800000 | 2281845000 |
| Friday, January 1, 2016 | 7139700000 | 2029647000 |
| Sunday, January 1, 2017 | 7969200000 | 2841159000 |
| Monday, January 1, 2018 | 9080500000 | 3151816000 |
| Tuesday, January 1, 2019 | 9636700000 | 6122400000 |
| Wednesday, January 1, 2020 | 9566700000 | 5657400000 |
| Friday, January 1, 2021 | 10423000000 | 5687000000 |
| Saturday, January 1, 2022 | 12663300000 | 6070000000 |
| Sunday, January 1, 2023 | 11683100000 | 6733000000 |
| Monday, January 1, 2024 | 10851300000 | 7021000000 |
Unlocking the unknown
In the ever-evolving landscape of industrial manufacturing, Westinghouse Air Brake Technologies Corporation and Stanley Black & Decker, Inc. stand as titans. Over the past decade, these companies have showcased distinct trajectories in their cost of revenue. From 2014 to 2023, Stanley Black & Decker's cost of revenue surged by approximately 61%, peaking in 2022. Meanwhile, Westinghouse Air Brake Technologies saw a remarkable 216% increase, highlighting its aggressive expansion strategy.
In 2014, Stanley Black & Decker's cost of revenue was nearly 3.4 times that of Westinghouse Air Brake Technologies. By 2023, this ratio narrowed to 1.7, reflecting Westinghouse's rapid growth. This trend underscores the dynamic shifts in the industrial sector, where strategic investments and market demands drive financial outcomes. As these companies continue to innovate, their financial strategies will be pivotal in shaping the future of manufacturing.
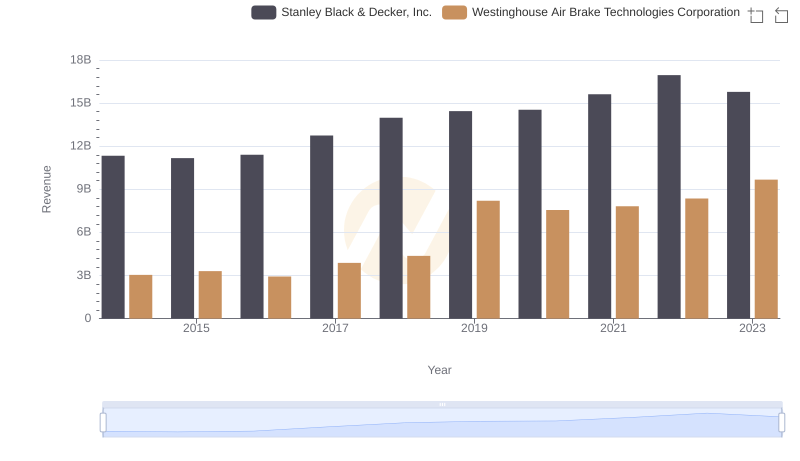
Westinghouse Air Brake Technologies Corporation vs Stanley Black & Decker, Inc.: Examining Key Revenue Metrics
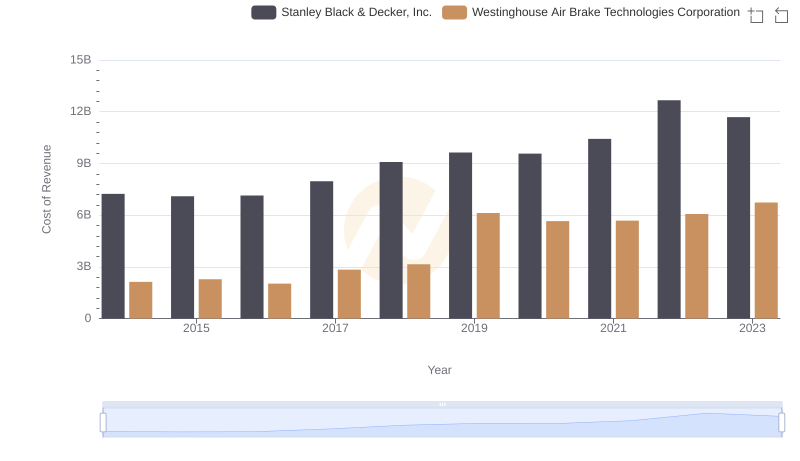
Cost of Revenue Trends: Westinghouse Air Brake Technologies Corporation vs Stanley Black & Decker, Inc.
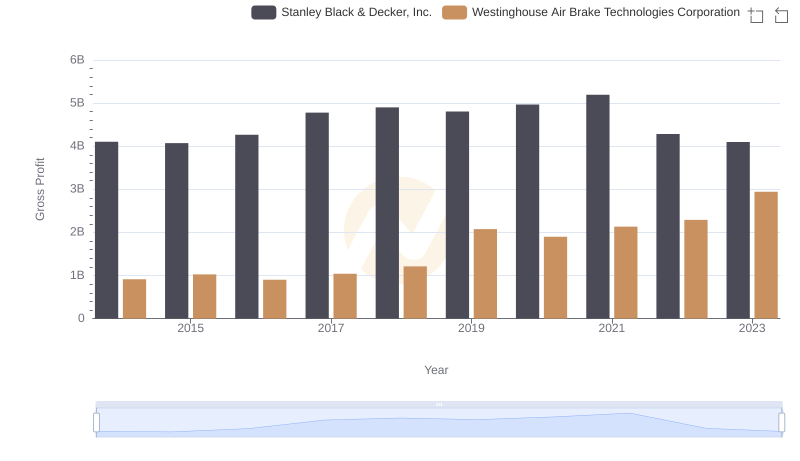
Who Generates Higher Gross Profit? Westinghouse Air Brake Technologies Corporation or Stanley Black & Decker, Inc.

Comparing Innovation Spending: Westinghouse Air Brake Technologies Corporation and Stanley Black & Decker, Inc.
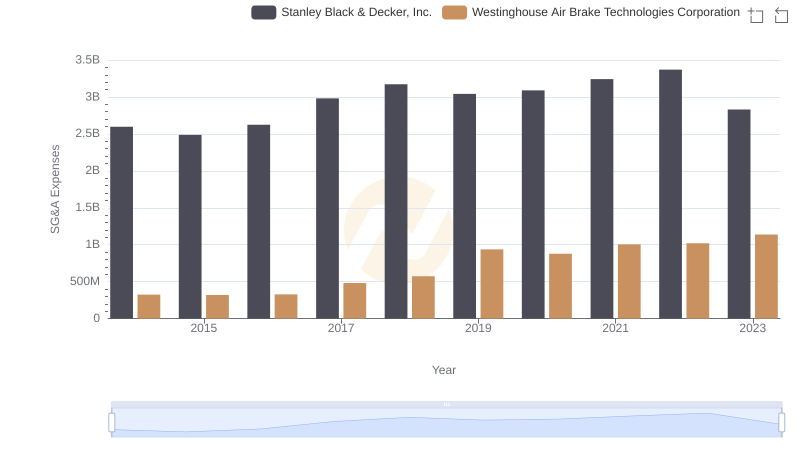
Who Optimizes SG&A Costs Better? Westinghouse Air Brake Technologies Corporation or Stanley Black & Decker, Inc.
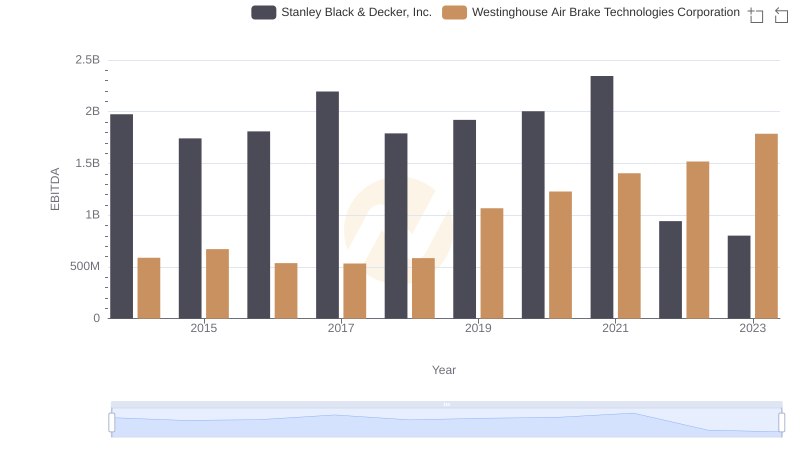
Comparative EBITDA Analysis: Westinghouse Air Brake Technologies Corporation vs Stanley Black & Decker, Inc.

Breaking Down Revenue Trends: Westinghouse Air Brake Technologies Corporation vs Stanley Black & Decker, Inc.
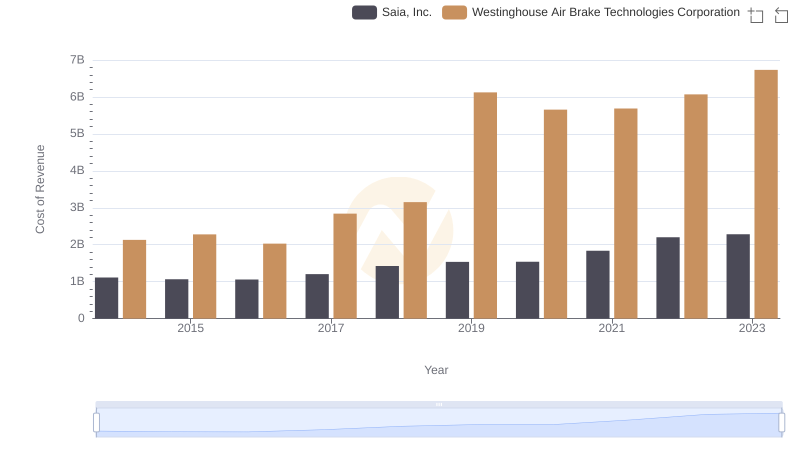
Comparing Cost of Revenue Efficiency: Westinghouse Air Brake Technologies Corporation vs Saia, Inc.

Who Generates Higher Gross Profit? Westinghouse Air Brake Technologies Corporation or Stanley Black & Decker, Inc.
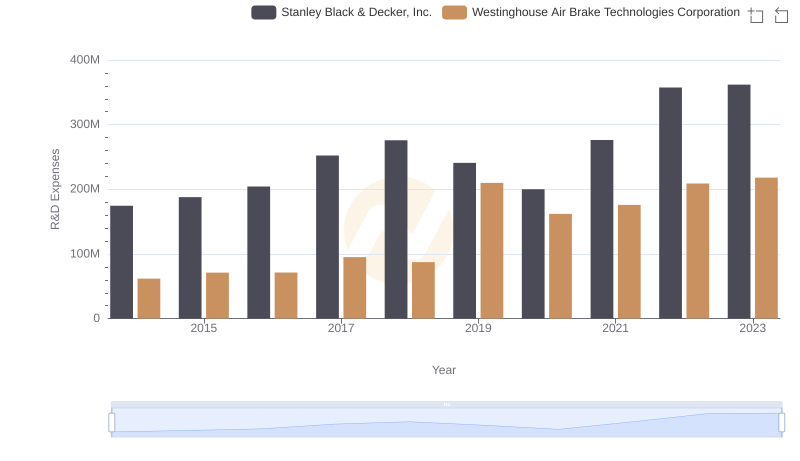
Westinghouse Air Brake Technologies Corporation vs Stanley Black & Decker, Inc.: Strategic Focus on R&D Spending

Selling, General, and Administrative Costs: Westinghouse Air Brake Technologies Corporation vs Stanley Black & Decker, Inc.

Westinghouse Air Brake Technologies Corporation and Stanley Black & Decker, Inc.: A Detailed Examination of EBITDA Performance