| __timestamp | Comfort Systems USA, Inc. | Westinghouse Air Brake Technologies Corporation |
|---|---|---|
| Wednesday, January 1, 2014 | 1161024000 | 2130920000 |
| Thursday, January 1, 2015 | 1262390000 | 2281845000 |
| Friday, January 1, 2016 | 1290331000 | 2029647000 |
| Sunday, January 1, 2017 | 1421641000 | 2841159000 |
| Monday, January 1, 2018 | 1736600000 | 3151816000 |
| Tuesday, January 1, 2019 | 2113334000 | 6122400000 |
| Wednesday, January 1, 2020 | 2309676000 | 5657400000 |
| Friday, January 1, 2021 | 2510429000 | 5687000000 |
| Saturday, January 1, 2022 | 3398756000 | 6070000000 |
| Sunday, January 1, 2023 | 4216251000 | 6733000000 |
| Monday, January 1, 2024 | 7021000000 |
Data in motion
In the ever-evolving landscape of industrial and construction services, understanding cost dynamics is crucial. Over the past decade, Westinghouse Air Brake Technologies Corporation and Comfort Systems USA, Inc. have shown distinct trends in their cost of revenue. From 2014 to 2023, Westinghouse's cost of revenue surged by approximately 216%, peaking in 2023. Meanwhile, Comfort Systems USA, Inc. experienced a remarkable 263% increase, reflecting its strategic growth in the construction services sector.
Westinghouse's cost of revenue consistently outpaced Comfort Systems, with a notable spike in 2019, reaching nearly three times its 2014 value. Comfort Systems, however, demonstrated a steady upward trajectory, culminating in a significant rise in 2023. These trends highlight the companies' differing strategies and market responses, offering valuable insights for investors and industry analysts alike.
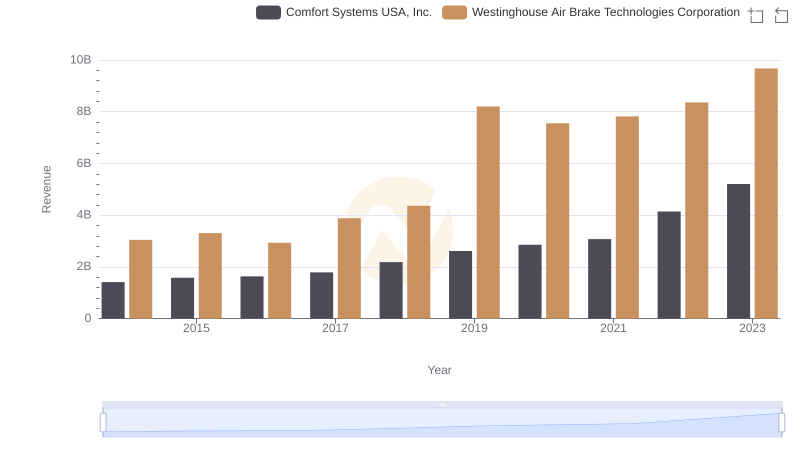
Revenue Insights: Westinghouse Air Brake Technologies Corporation and Comfort Systems USA, Inc. Performance Compared
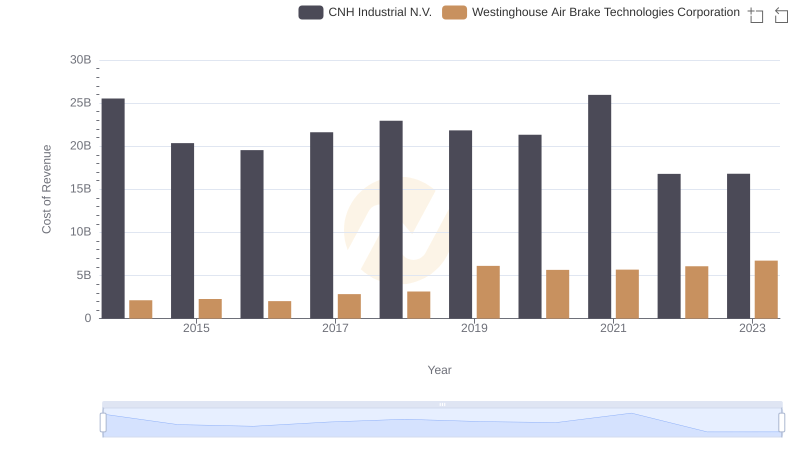
Cost Insights: Breaking Down Westinghouse Air Brake Technologies Corporation and CNH Industrial N.V.'s Expenses
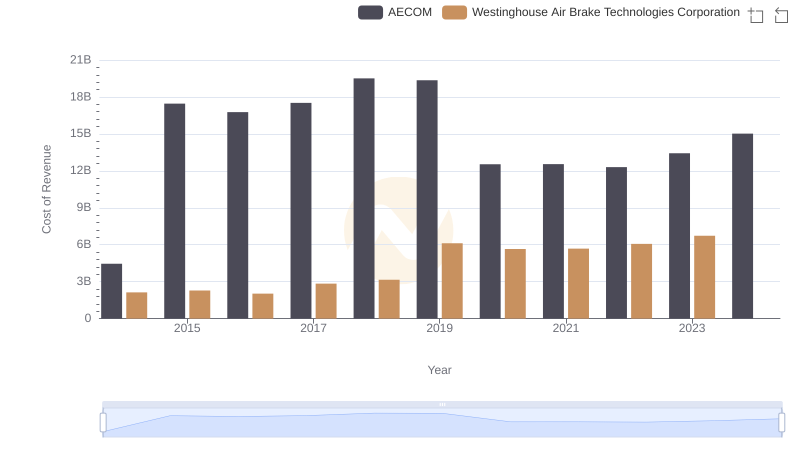
Analyzing Cost of Revenue: Westinghouse Air Brake Technologies Corporation and AECOM
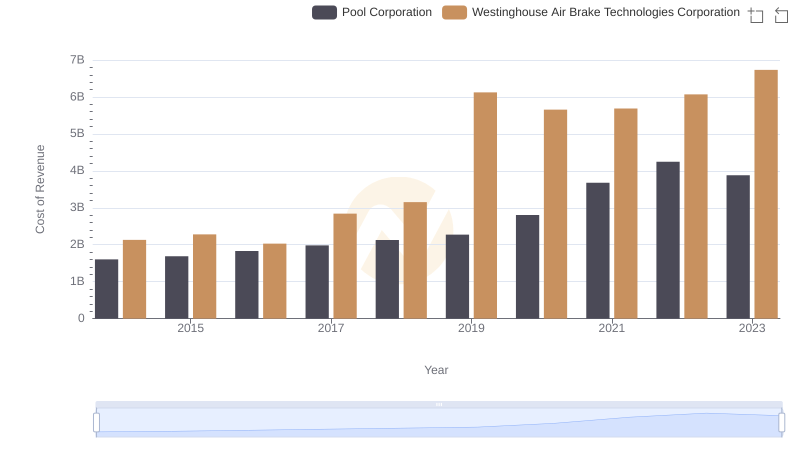
Cost of Revenue Comparison: Westinghouse Air Brake Technologies Corporation vs Pool Corporation
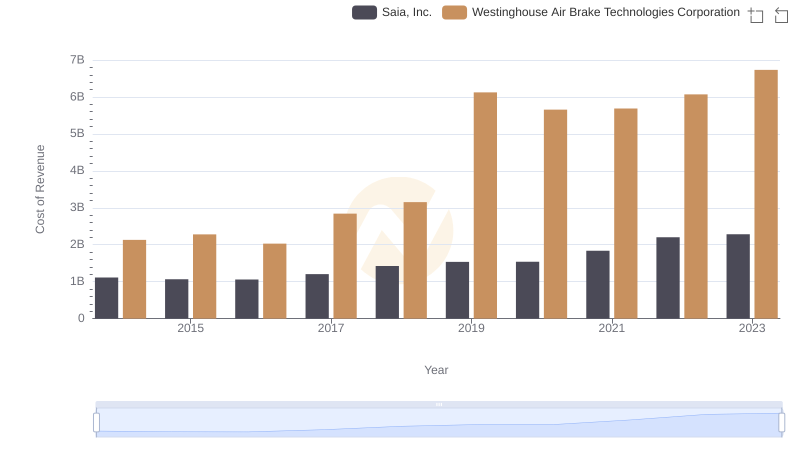
Comparing Cost of Revenue Efficiency: Westinghouse Air Brake Technologies Corporation vs Saia, Inc.
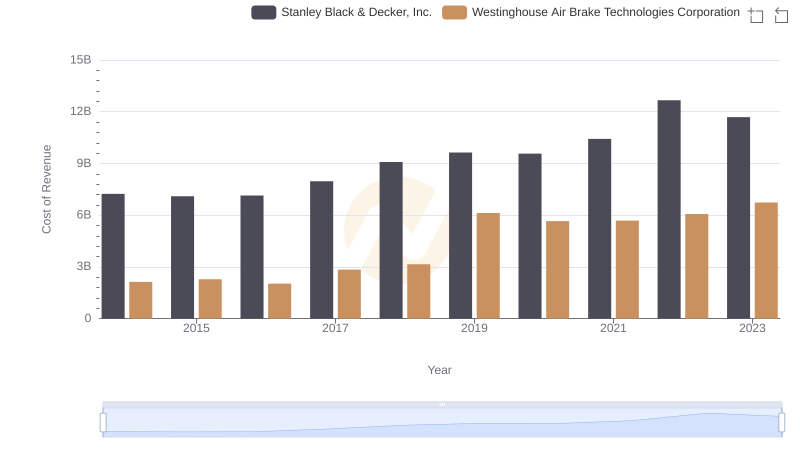
Cost of Revenue Comparison: Westinghouse Air Brake Technologies Corporation vs Stanley Black & Decker, Inc.
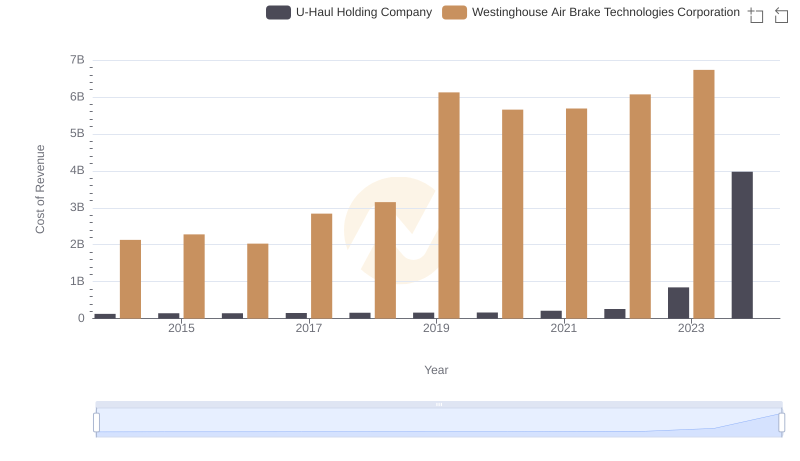
Cost Insights: Breaking Down Westinghouse Air Brake Technologies Corporation and U-Haul Holding Company's Expenses
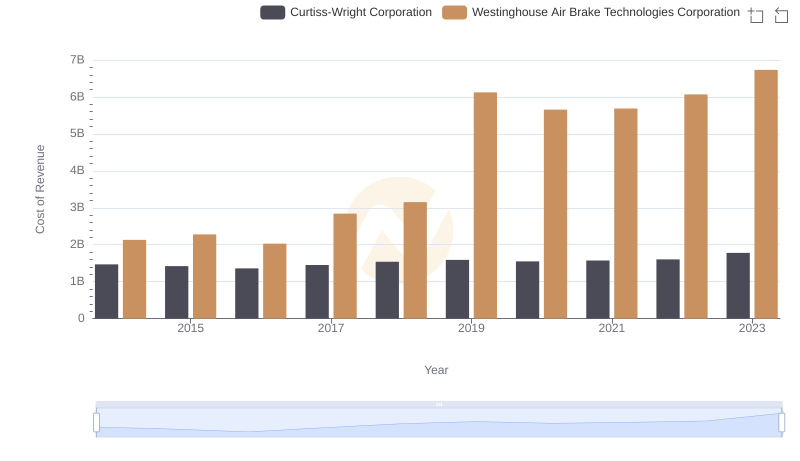
Westinghouse Air Brake Technologies Corporation vs Curtiss-Wright Corporation: Efficiency in Cost of Revenue Explored
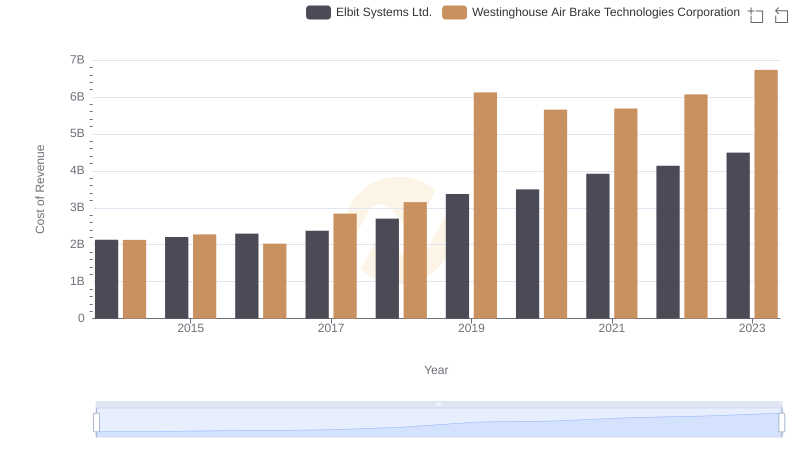
Cost of Revenue Trends: Westinghouse Air Brake Technologies Corporation vs Elbit Systems Ltd.
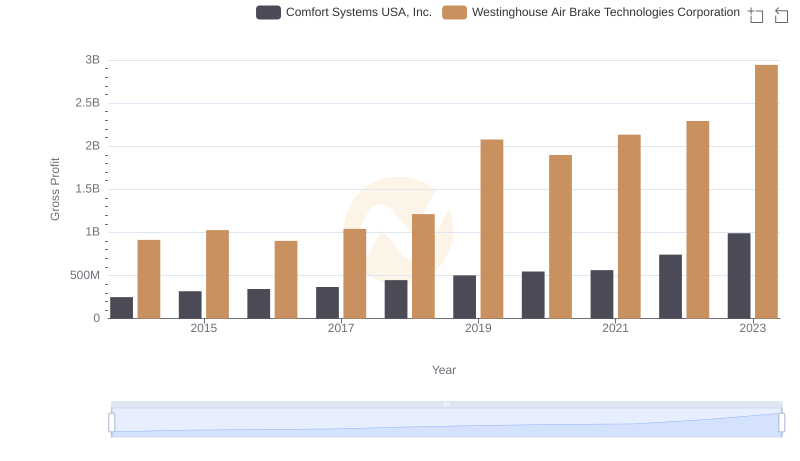
Westinghouse Air Brake Technologies Corporation and Comfort Systems USA, Inc.: A Detailed Gross Profit Analysis
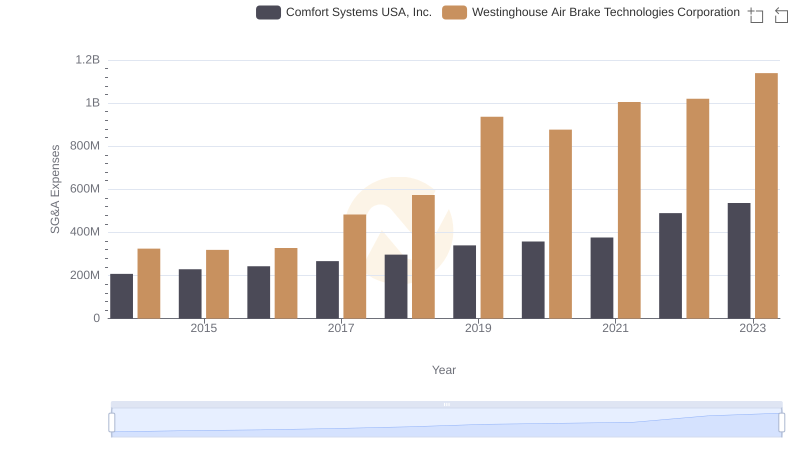
Westinghouse Air Brake Technologies Corporation vs Comfort Systems USA, Inc.: SG&A Expense Trends
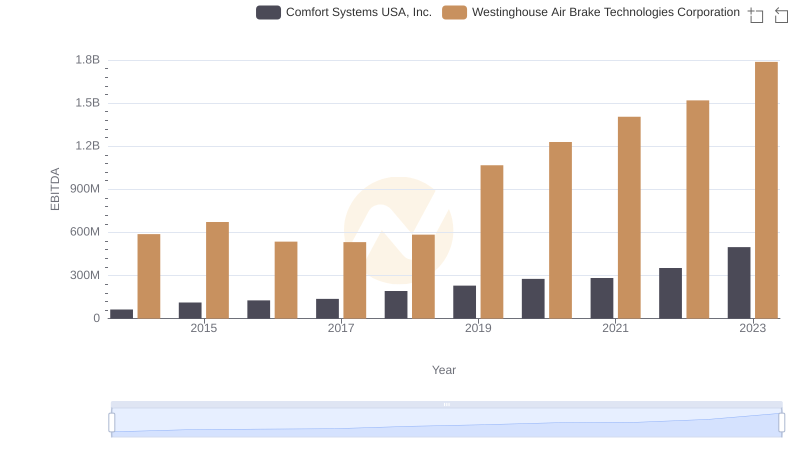
Westinghouse Air Brake Technologies Corporation vs Comfort Systems USA, Inc.: In-Depth EBITDA Performance Comparison