| __timestamp | Graco Inc. | Westinghouse Air Brake Technologies Corporation |
|---|---|---|
| Wednesday, January 1, 2014 | 554394000 | 2130920000 |
| Thursday, January 1, 2015 | 601785000 | 2281845000 |
| Friday, January 1, 2016 | 621054000 | 2029647000 |
| Sunday, January 1, 2017 | 681695000 | 2841159000 |
| Monday, January 1, 2018 | 770753000 | 3151816000 |
| Tuesday, January 1, 2019 | 786289000 | 6122400000 |
| Wednesday, January 1, 2020 | 795178000 | 5657400000 |
| Friday, January 1, 2021 | 953659000 | 5687000000 |
| Saturday, January 1, 2022 | 1086082000 | 6070000000 |
| Sunday, January 1, 2023 | 1034585000 | 6733000000 |
| Monday, January 1, 2024 | 990855000 | 7021000000 |
Unveiling the hidden dimensions of data
In the ever-evolving landscape of industrial manufacturing, understanding cost dynamics is crucial. Westinghouse Air Brake Technologies Corporation and Graco Inc. have shown distinct trajectories in their cost of revenue from 2014 to 2023. Graco Inc. has seen a steady increase, with costs rising approximately 86% over the decade, peaking in 2022. Meanwhile, Westinghouse Air Brake Technologies Corporation experienced a more volatile journey, with a significant surge of nearly 200% from 2014 to 2023. Notably, 2019 marked a pivotal year for Westinghouse, with costs nearly doubling from the previous year. This data highlights the contrasting financial strategies and market conditions faced by these industry giants. As we look to the future, the absence of data for 2024 for Westinghouse suggests potential shifts or challenges ahead. Understanding these trends offers valuable insights for investors and industry analysts alike.
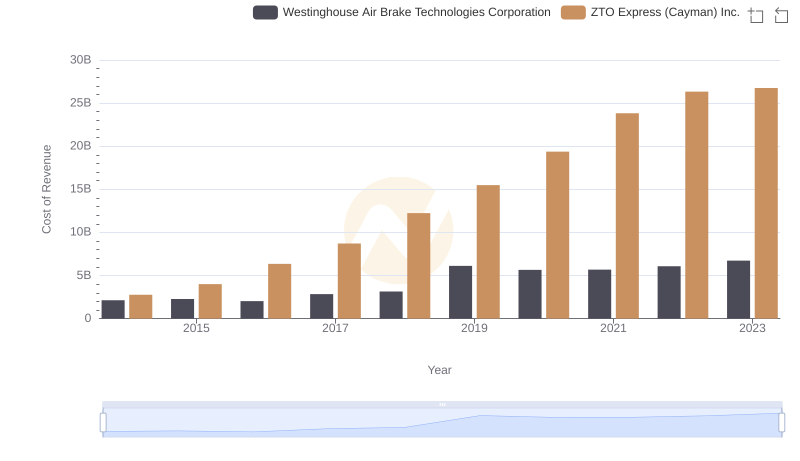
Cost of Revenue Trends: Westinghouse Air Brake Technologies Corporation vs ZTO Express (Cayman) Inc.
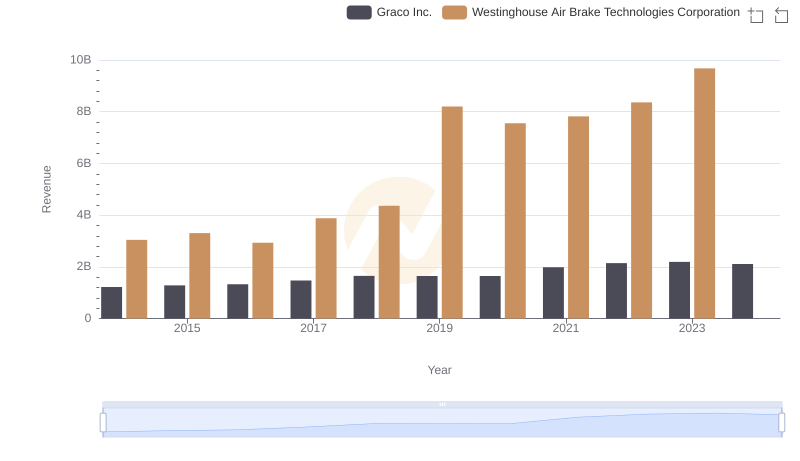
Westinghouse Air Brake Technologies Corporation vs Graco Inc.: Annual Revenue Growth Compared
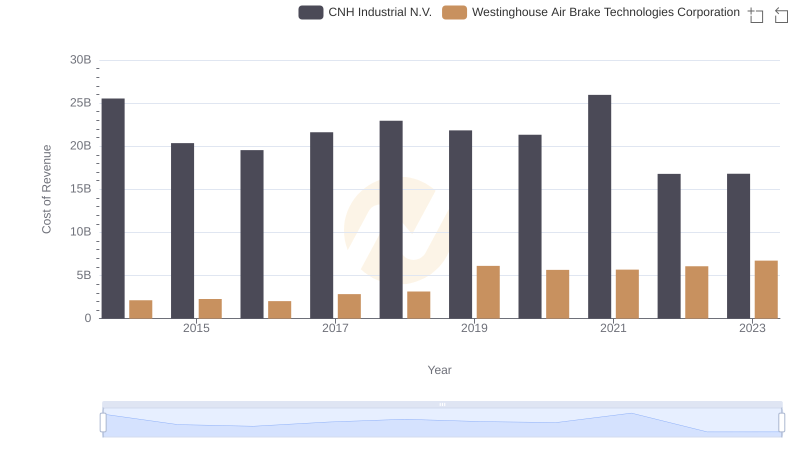
Cost Insights: Breaking Down Westinghouse Air Brake Technologies Corporation and CNH Industrial N.V.'s Expenses
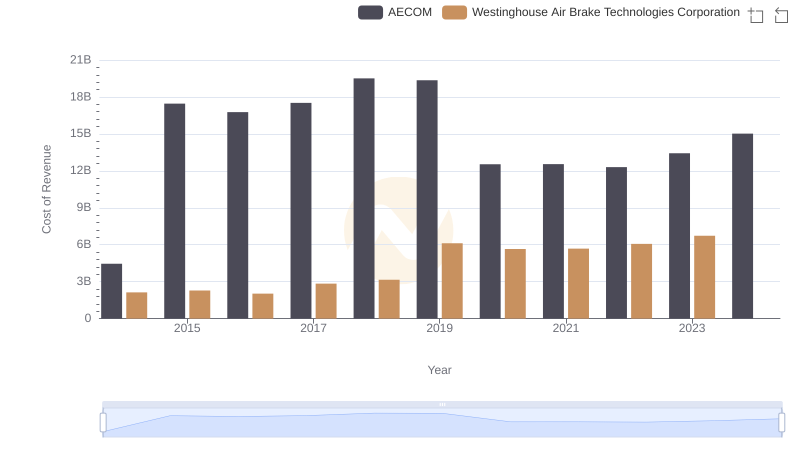
Analyzing Cost of Revenue: Westinghouse Air Brake Technologies Corporation and AECOM
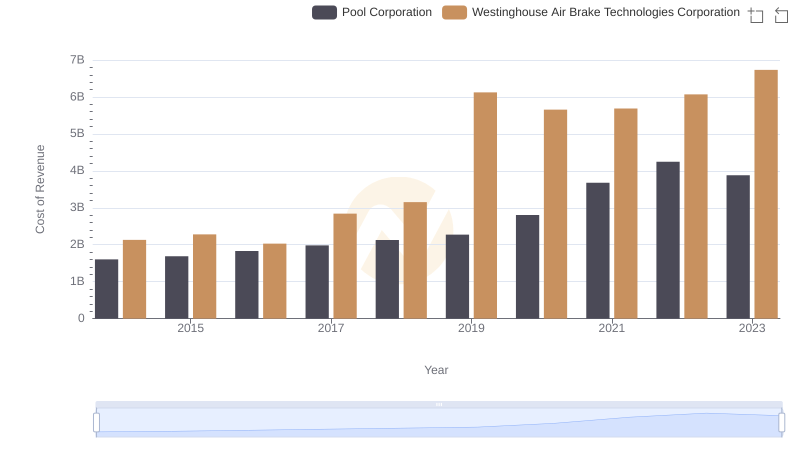
Cost of Revenue Comparison: Westinghouse Air Brake Technologies Corporation vs Pool Corporation
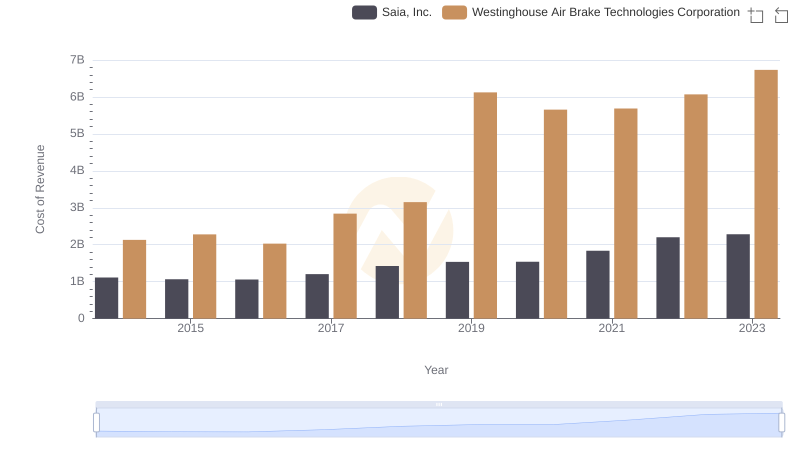
Comparing Cost of Revenue Efficiency: Westinghouse Air Brake Technologies Corporation vs Saia, Inc.
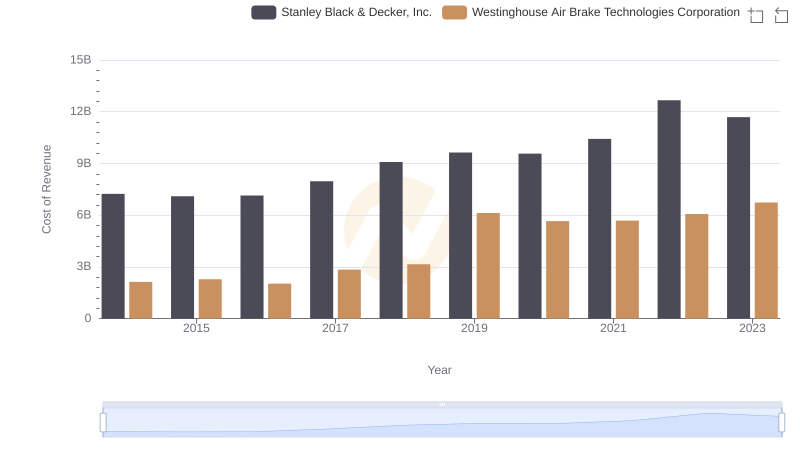
Cost of Revenue Comparison: Westinghouse Air Brake Technologies Corporation vs Stanley Black & Decker, Inc.
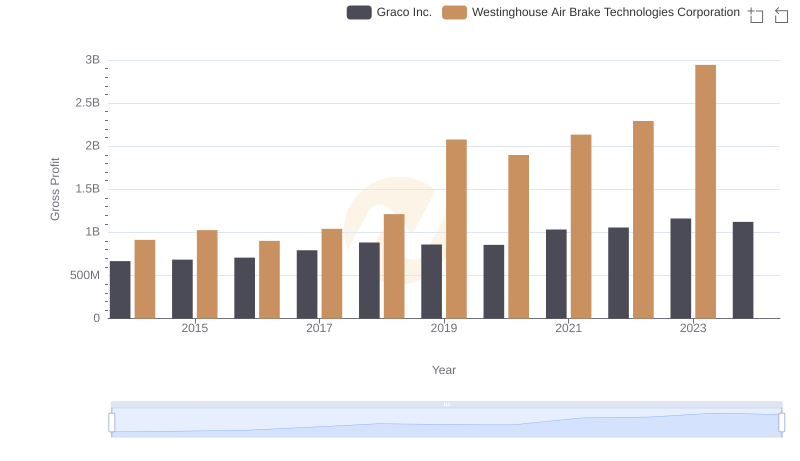
Who Generates Higher Gross Profit? Westinghouse Air Brake Technologies Corporation or Graco Inc.
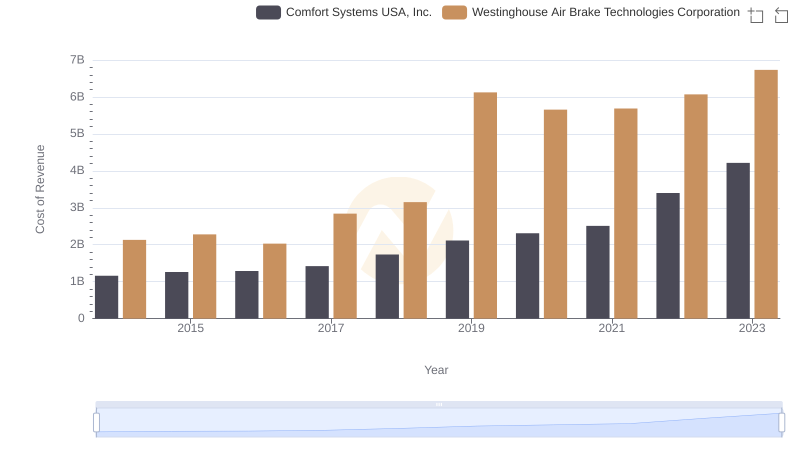
Cost of Revenue Trends: Westinghouse Air Brake Technologies Corporation vs Comfort Systems USA, Inc.
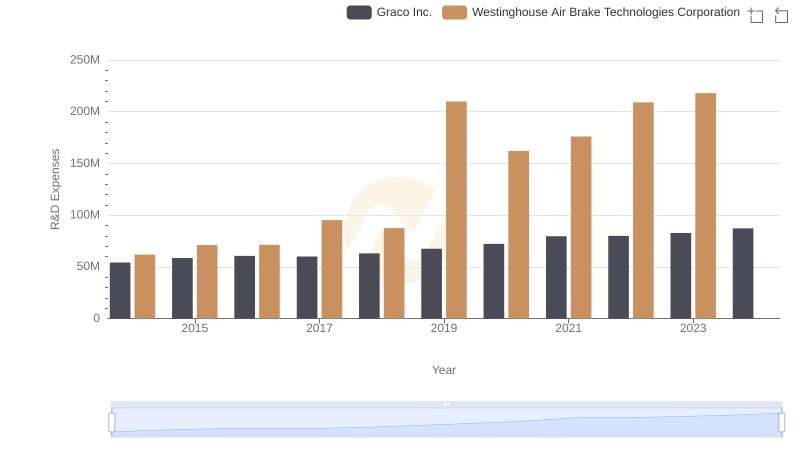
Who Prioritizes Innovation? R&D Spending Compared for Westinghouse Air Brake Technologies Corporation and Graco Inc.
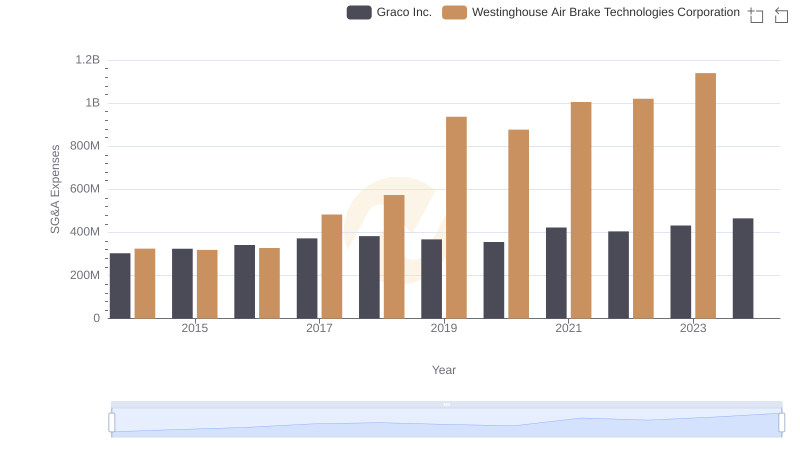
Selling, General, and Administrative Costs: Westinghouse Air Brake Technologies Corporation vs Graco Inc.
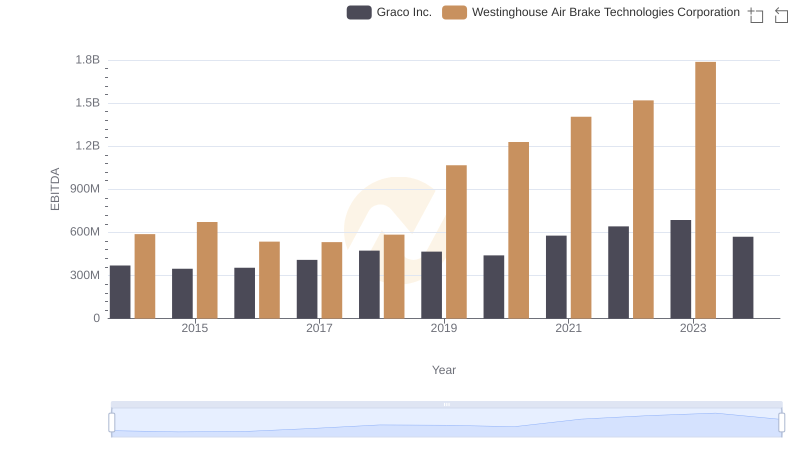
Westinghouse Air Brake Technologies Corporation and Graco Inc.: A Detailed Examination of EBITDA Performance