| __timestamp | Lennox International Inc. | Old Dominion Freight Line, Inc. |
|---|---|---|
| Wednesday, January 1, 2014 | 2464100000 | 2100409000 |
| Thursday, January 1, 2015 | 2520000000 | 2214943000 |
| Friday, January 1, 2016 | 2565100000 | 2246890000 |
| Sunday, January 1, 2017 | 2714400000 | 2482732000 |
| Monday, January 1, 2018 | 2772700000 | 2899452000 |
| Tuesday, January 1, 2019 | 2727400000 | 2938895000 |
| Wednesday, January 1, 2020 | 2594000000 | 2786531000 |
| Friday, January 1, 2021 | 3005700000 | 3481268000 |
| Saturday, January 1, 2022 | 3433700000 | 4003951000 |
| Sunday, January 1, 2023 | 3434100000 | 3793953000 |
| Monday, January 1, 2024 | 3569400000 |
Unveiling the hidden dimensions of data
In the competitive landscape of American industry, Old Dominion Freight Line, Inc. and Lennox International Inc. stand as titans in their respective fields. Over the past decade, these companies have showcased intriguing trends in their cost of revenue, a critical metric reflecting the direct costs attributable to the production of goods sold.
From 2014 to 2023, Lennox International Inc. experienced a steady increase in its cost of revenue, growing approximately 45% from $2.46 billion to $3.57 billion. This upward trajectory highlights the company's expanding operations and market reach. Meanwhile, Old Dominion Freight Line, Inc. saw a remarkable 80% surge, peaking at $4 billion in 2022, before a slight dip in 2023.
These trends underscore the dynamic nature of these industries, with Old Dominion's logistics prowess and Lennox's manufacturing excellence driving their financial narratives. Missing data for 2024 suggests a potential shift or recalibration in strategies.
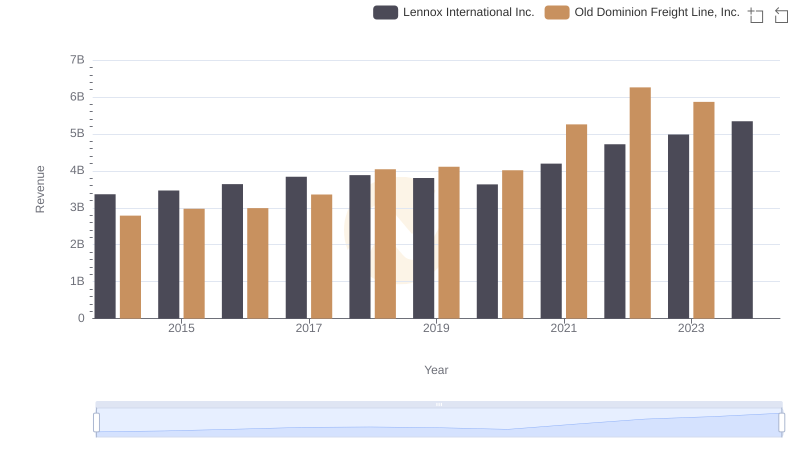
Old Dominion Freight Line, Inc. vs Lennox International Inc.: Annual Revenue Growth Compared
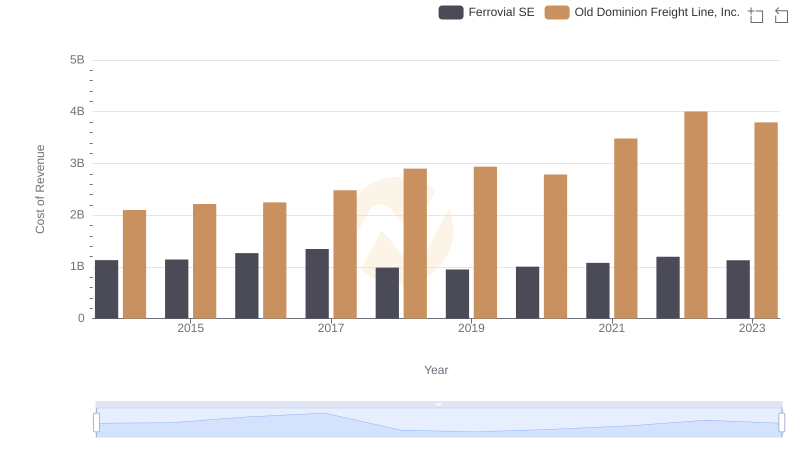
Analyzing Cost of Revenue: Old Dominion Freight Line, Inc. and Ferrovial SE
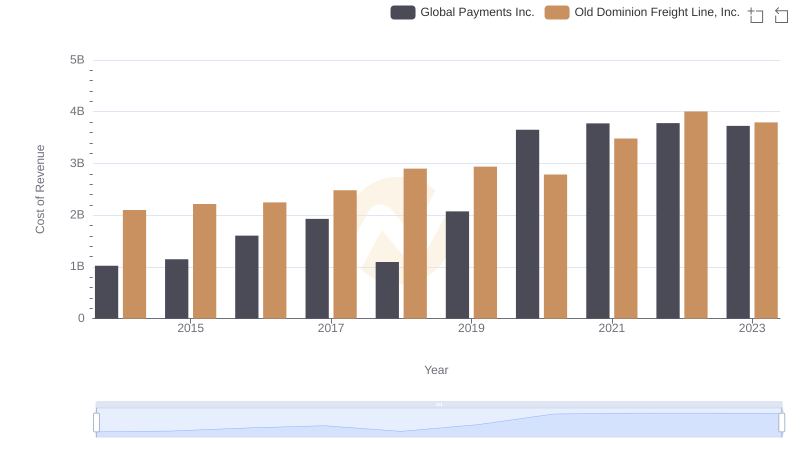
Comparing Cost of Revenue Efficiency: Old Dominion Freight Line, Inc. vs Global Payments Inc.
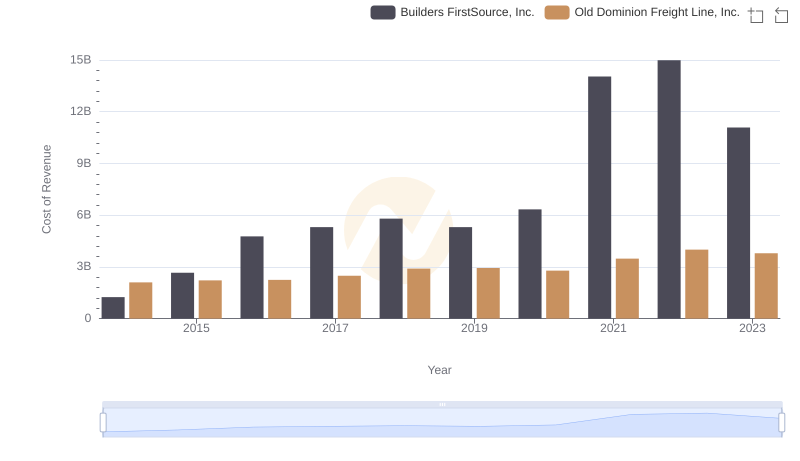
Cost Insights: Breaking Down Old Dominion Freight Line, Inc. and Builders FirstSource, Inc.'s Expenses
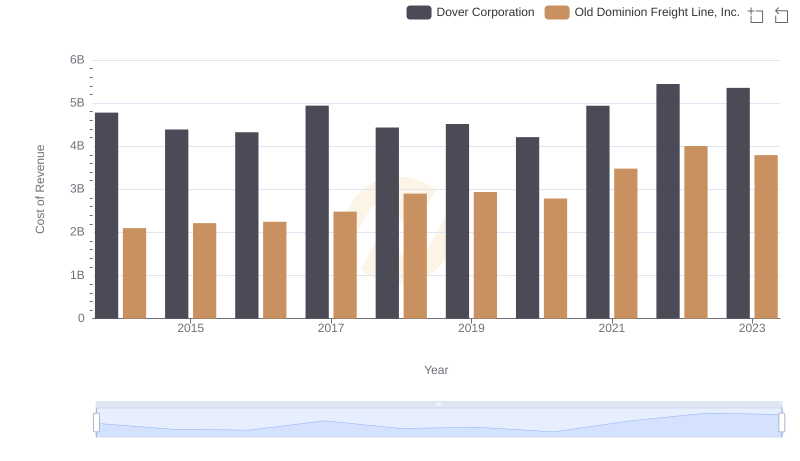
Cost of Revenue Comparison: Old Dominion Freight Line, Inc. vs Dover Corporation
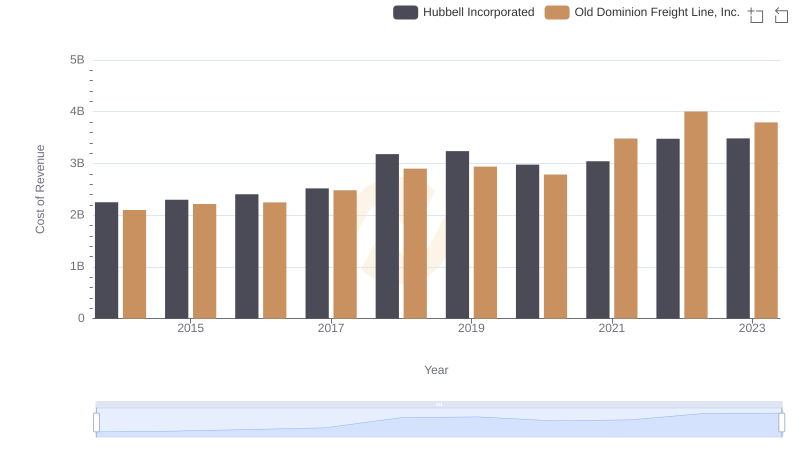
Cost of Revenue: Key Insights for Old Dominion Freight Line, Inc. and Hubbell Incorporated
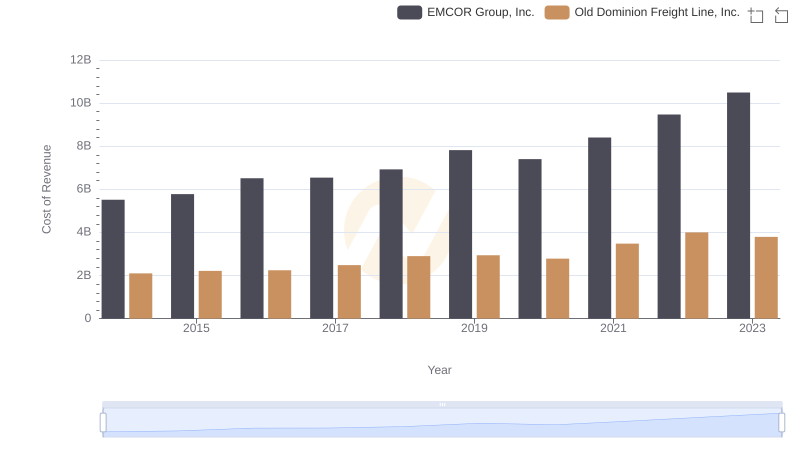
Cost of Revenue Comparison: Old Dominion Freight Line, Inc. vs EMCOR Group, Inc.
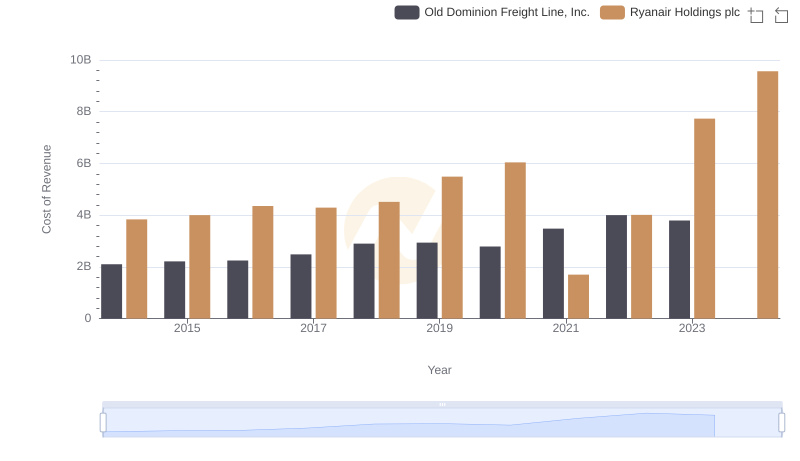
Cost Insights: Breaking Down Old Dominion Freight Line, Inc. and Ryanair Holdings plc's Expenses
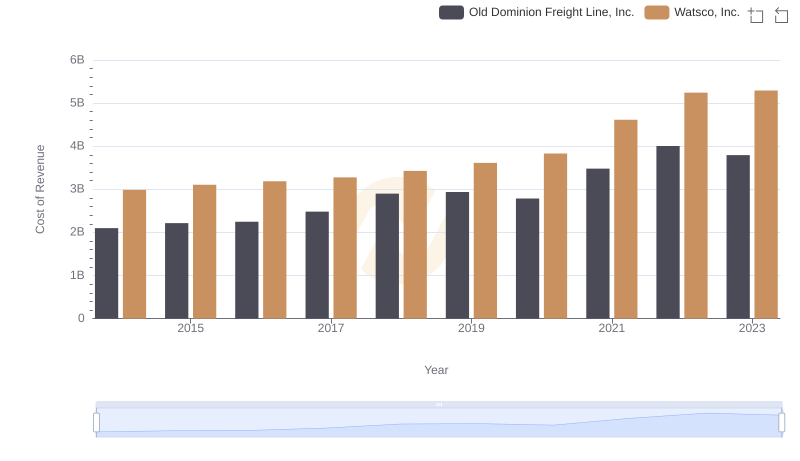
Cost of Revenue Trends: Old Dominion Freight Line, Inc. vs Watsco, Inc.
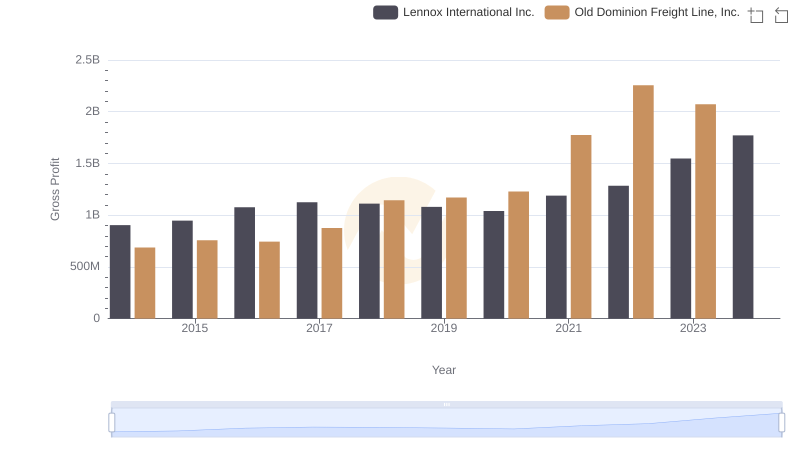
Gross Profit Analysis: Comparing Old Dominion Freight Line, Inc. and Lennox International Inc.
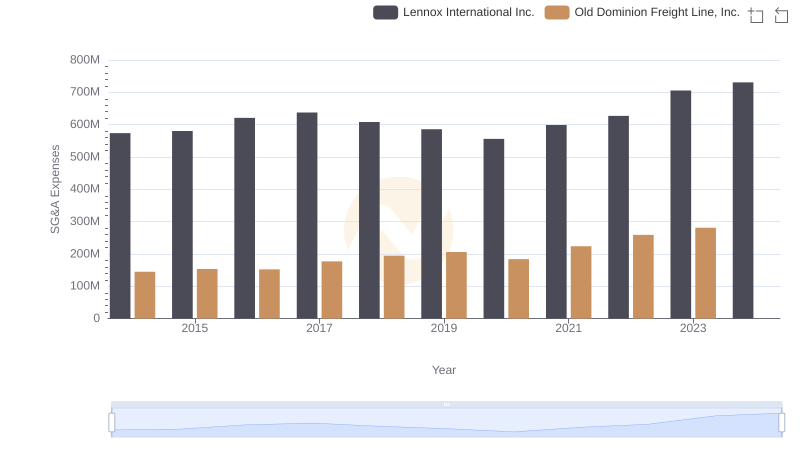
Breaking Down SG&A Expenses: Old Dominion Freight Line, Inc. vs Lennox International Inc.