| __timestamp | Ferrovial SE | Old Dominion Freight Line, Inc. |
|---|---|---|
| Wednesday, January 1, 2014 | 1131000000 | 2100409000 |
| Thursday, January 1, 2015 | 1143000000 | 2214943000 |
| Friday, January 1, 2016 | 1267000000 | 2246890000 |
| Sunday, January 1, 2017 | 1345000000 | 2482732000 |
| Monday, January 1, 2018 | 985000000 | 2899452000 |
| Tuesday, January 1, 2019 | 949000000 | 2938895000 |
| Wednesday, January 1, 2020 | 1005000000 | 2786531000 |
| Friday, January 1, 2021 | 1077000000 | 3481268000 |
| Saturday, January 1, 2022 | 1197000000 | 4003951000 |
| Sunday, January 1, 2023 | 1129000000 | 3793953000 |
Cracking the code
In the world of logistics and infrastructure, Old Dominion Freight Line, Inc. and Ferrovial SE stand as titans. Over the past decade, these companies have showcased contrasting trends in their cost of revenue. Old Dominion Freight Line, Inc. has seen a remarkable increase of approximately 80% from 2014 to 2023, reflecting its aggressive expansion and operational efficiency. In contrast, Ferrovial SE's cost of revenue has remained relatively stable, with a slight dip in 2018 and 2019, indicating a strategic focus on cost management.
These insights provide a window into the strategic priorities of these industry leaders.
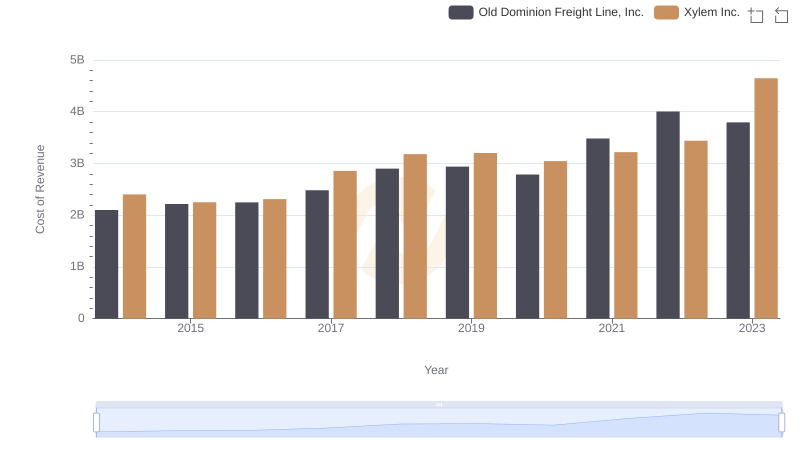
Cost Insights: Breaking Down Old Dominion Freight Line, Inc. and Xylem Inc.'s Expenses
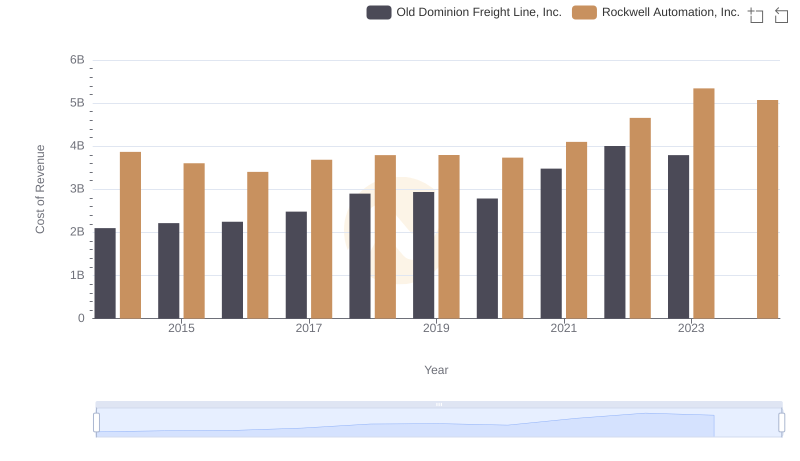
Comparing Cost of Revenue Efficiency: Old Dominion Freight Line, Inc. vs Rockwell Automation, Inc.
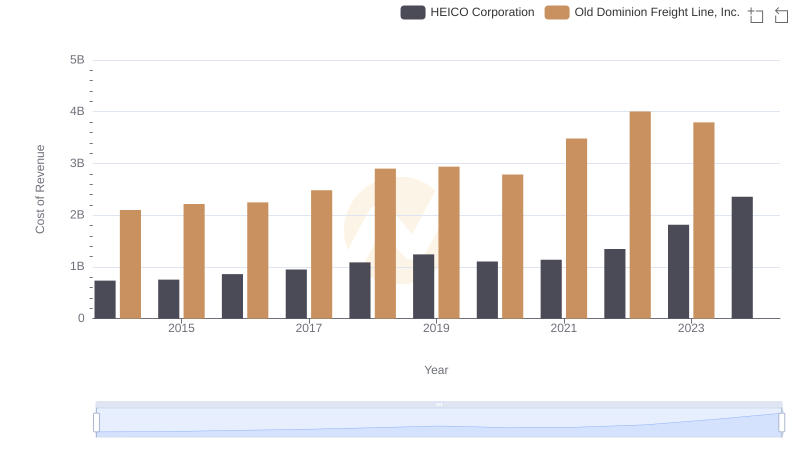
Cost of Revenue Trends: Old Dominion Freight Line, Inc. vs HEICO Corporation
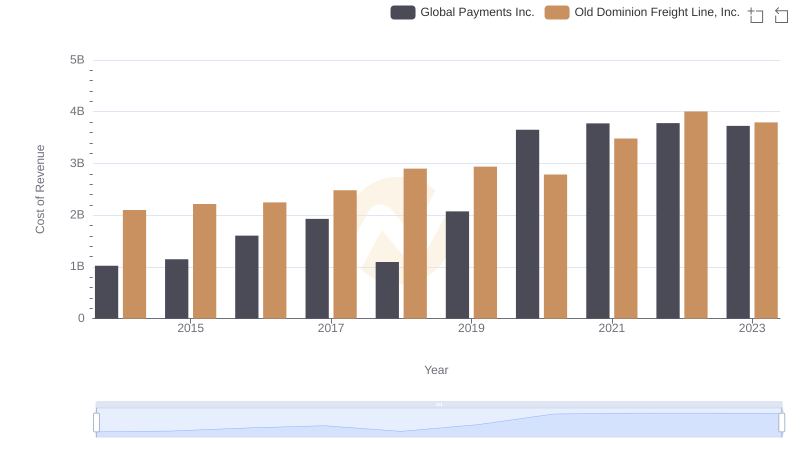
Comparing Cost of Revenue Efficiency: Old Dominion Freight Line, Inc. vs Global Payments Inc.
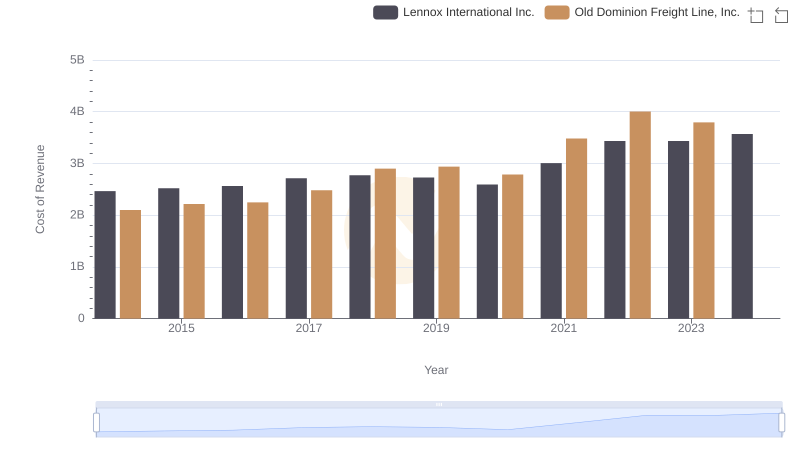
Cost of Revenue Comparison: Old Dominion Freight Line, Inc. vs Lennox International Inc.
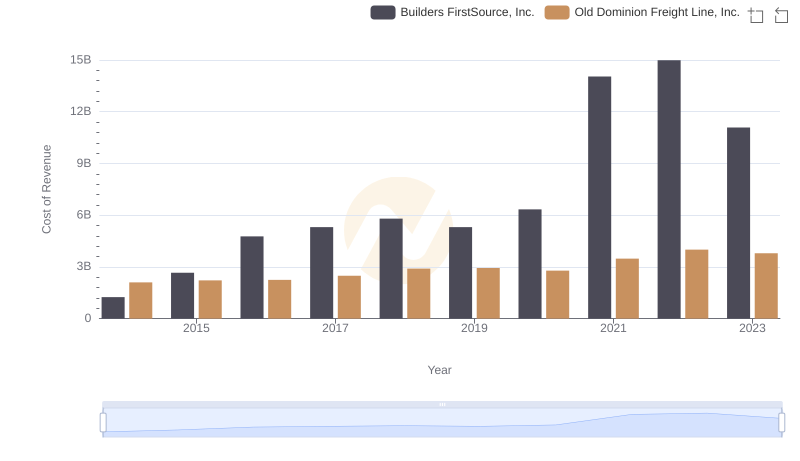
Cost Insights: Breaking Down Old Dominion Freight Line, Inc. and Builders FirstSource, Inc.'s Expenses
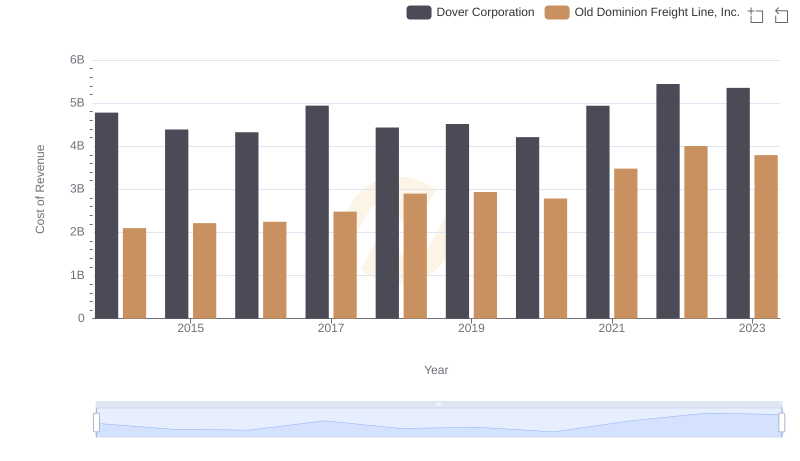
Cost of Revenue Comparison: Old Dominion Freight Line, Inc. vs Dover Corporation
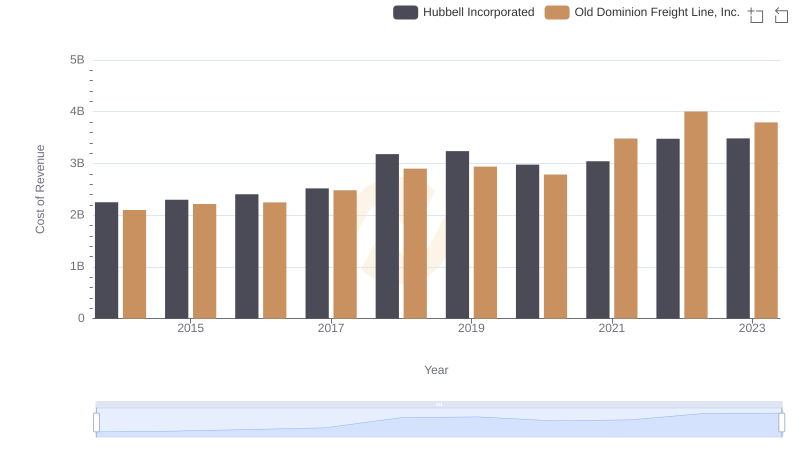
Cost of Revenue: Key Insights for Old Dominion Freight Line, Inc. and Hubbell Incorporated
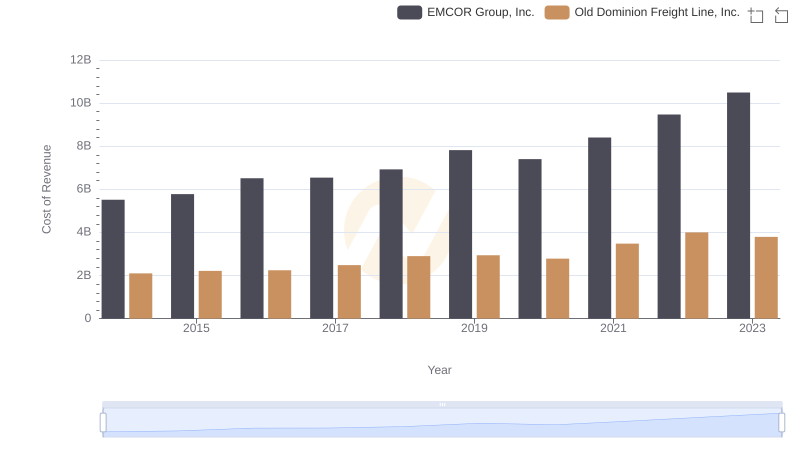
Cost of Revenue Comparison: Old Dominion Freight Line, Inc. vs EMCOR Group, Inc.
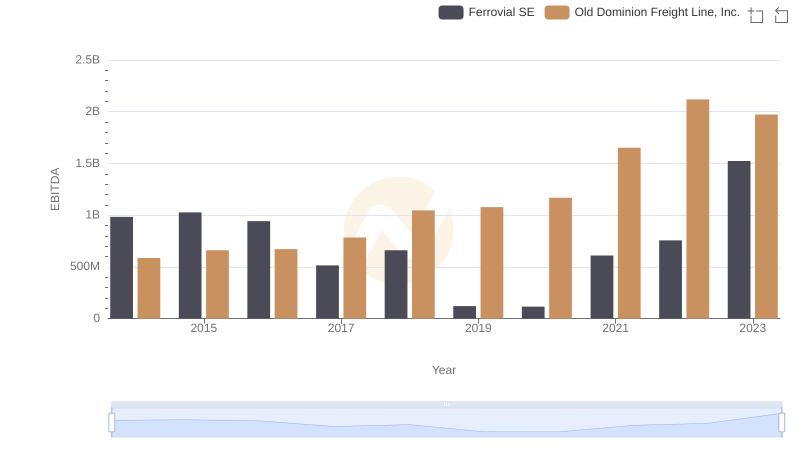
EBITDA Analysis: Evaluating Old Dominion Freight Line, Inc. Against Ferrovial SE