| __timestamp | EMCOR Group, Inc. | Old Dominion Freight Line, Inc. |
|---|---|---|
| Wednesday, January 1, 2014 | 5517719000 | 2100409000 |
| Thursday, January 1, 2015 | 5774247000 | 2214943000 |
| Friday, January 1, 2016 | 6513662000 | 2246890000 |
| Sunday, January 1, 2017 | 6539987000 | 2482732000 |
| Monday, January 1, 2018 | 6925178000 | 2899452000 |
| Tuesday, January 1, 2019 | 7818743000 | 2938895000 |
| Wednesday, January 1, 2020 | 7401679000 | 2786531000 |
| Friday, January 1, 2021 | 8401843000 | 3481268000 |
| Saturday, January 1, 2022 | 9472526000 | 4003951000 |
| Sunday, January 1, 2023 | 10493534000 | 3793953000 |
Unleashing the power of data
In the competitive landscape of the transportation and construction industries, Old Dominion Freight Line, Inc. and EMCOR Group, Inc. have showcased distinct financial trajectories over the past decade. From 2014 to 2023, EMCOR Group's cost of revenue surged by approximately 90%, reflecting its expansive growth and operational scale. In contrast, Old Dominion Freight Line experienced a more modest increase of around 80%, highlighting its strategic efficiency in managing costs.
EMCOR Group's cost of revenue consistently outpaced Old Dominion's, peaking at over $10 billion in 2023. This growth underscores EMCOR's robust market presence and adaptability in a dynamic economic environment. Meanwhile, Old Dominion's cost of revenue reached nearly $4 billion, demonstrating its steady expansion and commitment to cost-effective operations. As these industry leaders continue to evolve, their financial strategies offer valuable insights into the broader economic trends shaping their respective sectors.
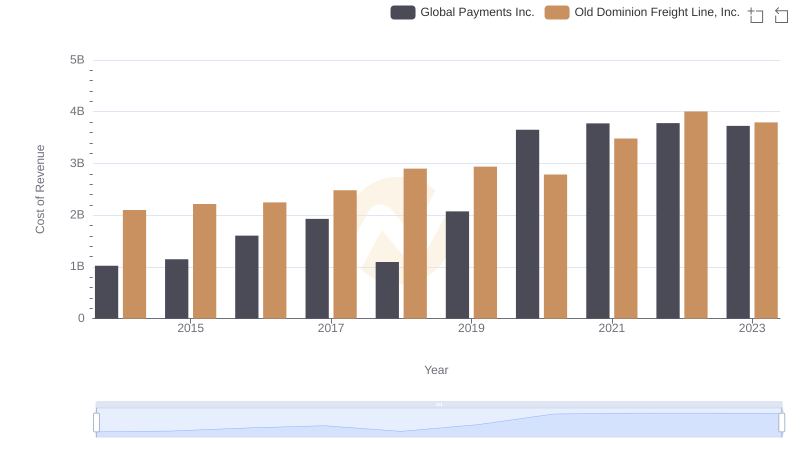
Comparing Cost of Revenue Efficiency: Old Dominion Freight Line, Inc. vs Global Payments Inc.
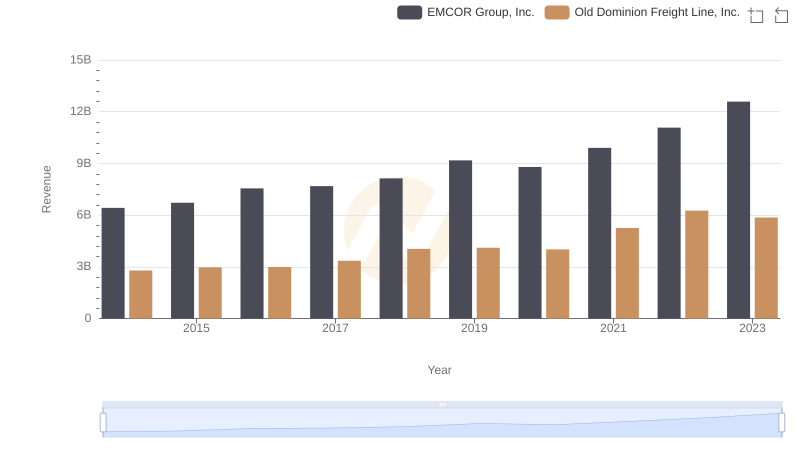
Who Generates More Revenue? Old Dominion Freight Line, Inc. or EMCOR Group, Inc.
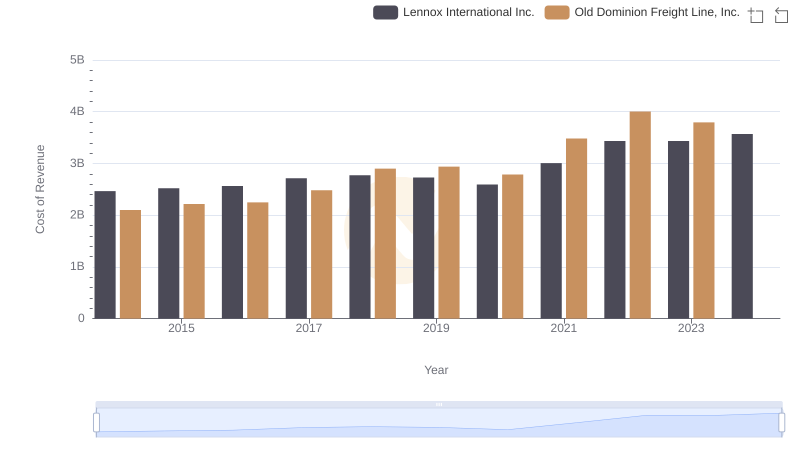
Cost of Revenue Comparison: Old Dominion Freight Line, Inc. vs Lennox International Inc.
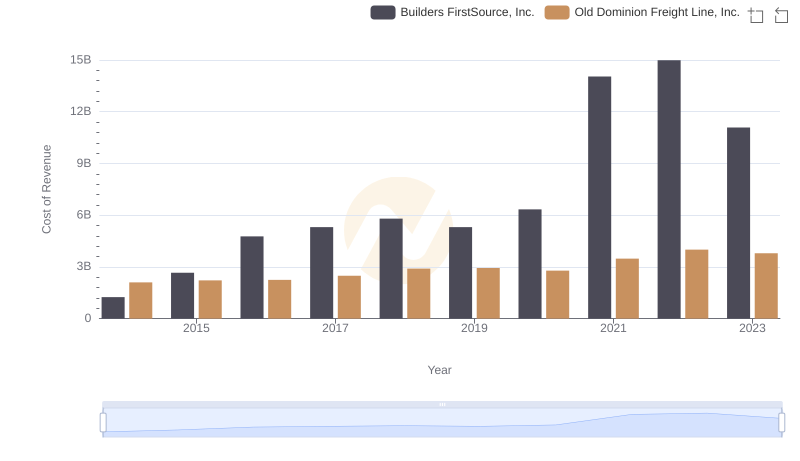
Cost Insights: Breaking Down Old Dominion Freight Line, Inc. and Builders FirstSource, Inc.'s Expenses
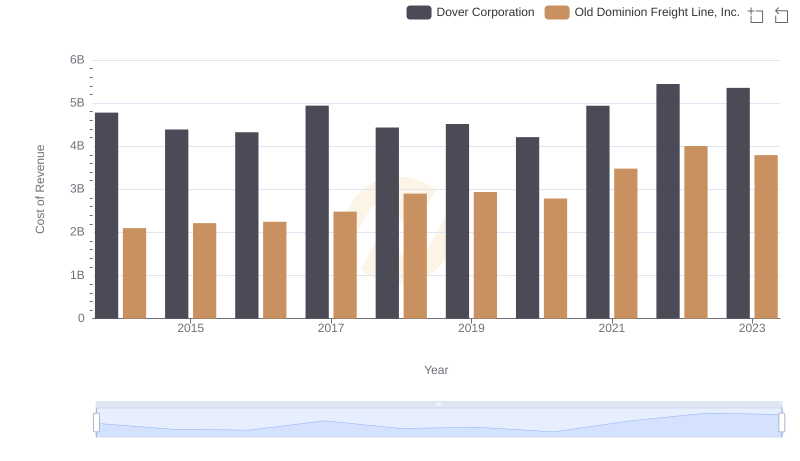
Cost of Revenue Comparison: Old Dominion Freight Line, Inc. vs Dover Corporation
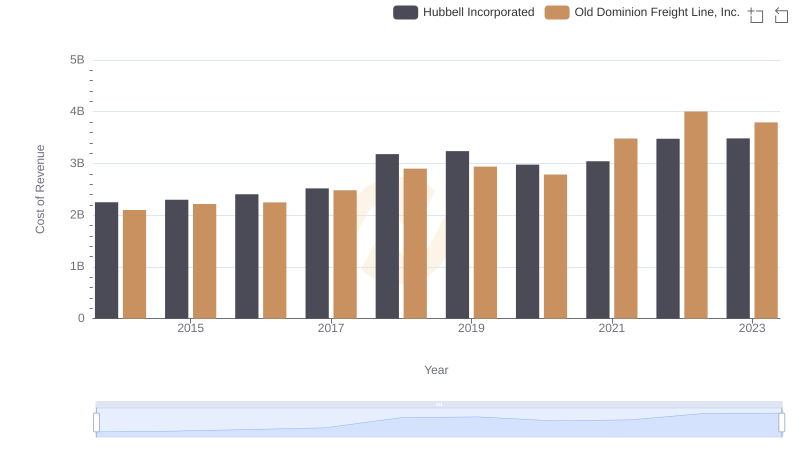
Cost of Revenue: Key Insights for Old Dominion Freight Line, Inc. and Hubbell Incorporated
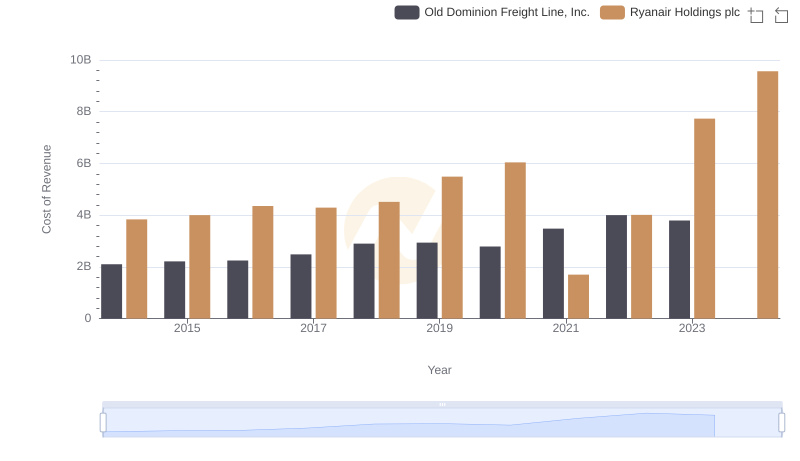
Cost Insights: Breaking Down Old Dominion Freight Line, Inc. and Ryanair Holdings plc's Expenses
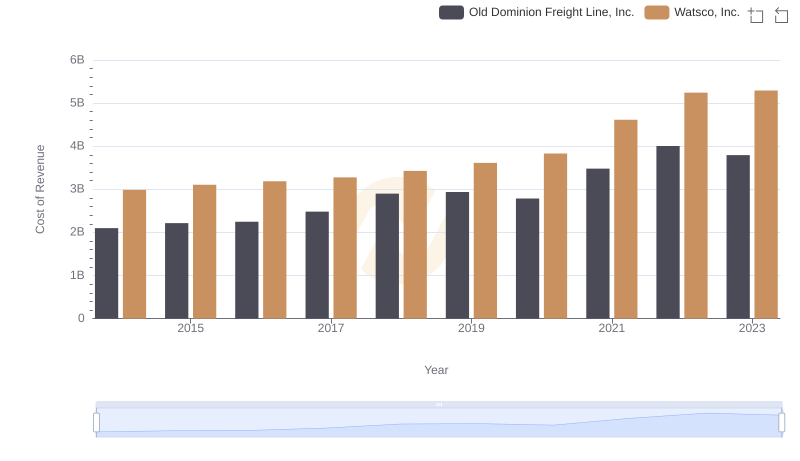
Cost of Revenue Trends: Old Dominion Freight Line, Inc. vs Watsco, Inc.
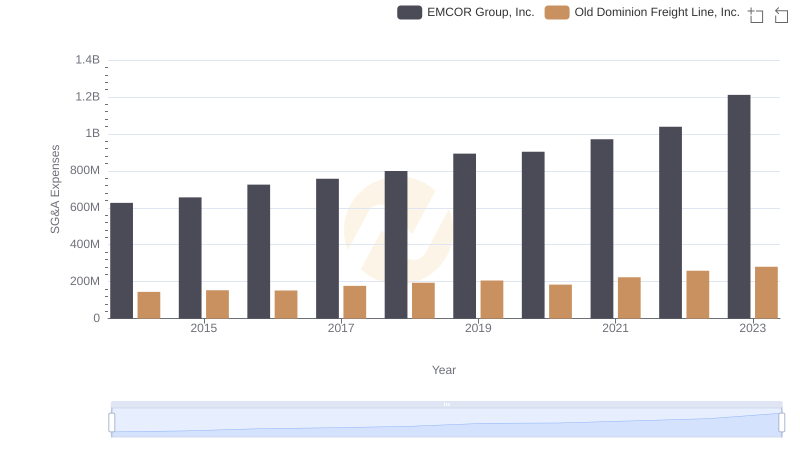
Old Dominion Freight Line, Inc. vs EMCOR Group, Inc.: SG&A Expense Trends