| __timestamp | Lennox International Inc. | Old Dominion Freight Line, Inc. |
|---|---|---|
| Wednesday, January 1, 2014 | 3367400000 | 2787897000 |
| Thursday, January 1, 2015 | 3467400000 | 2972442000 |
| Friday, January 1, 2016 | 3641600000 | 2991517000 |
| Sunday, January 1, 2017 | 3839600000 | 3358112000 |
| Monday, January 1, 2018 | 3883900000 | 4043695000 |
| Tuesday, January 1, 2019 | 3807200000 | 4109111000 |
| Wednesday, January 1, 2020 | 3634100000 | 4015129000 |
| Friday, January 1, 2021 | 4194100000 | 5256328000 |
| Saturday, January 1, 2022 | 4718400000 | 6260077000 |
| Sunday, January 1, 2023 | 4981900000 | 5866152000 |
| Monday, January 1, 2024 | 5341300000 |
Unleashing the power of data
In the competitive landscape of American industry, Old Dominion Freight Line and Lennox International have carved out significant niches. From 2014 to 2023, these companies have shown remarkable revenue growth, with Lennox International's revenue increasing by approximately 59% and Old Dominion Freight Line's by about 110%. This growth reflects their strategic adaptability and market resilience.
Lennox International, a leader in climate control solutions, saw steady growth, peaking in 2024 with a revenue of $5.34 billion. Meanwhile, Old Dominion Freight Line, a powerhouse in freight logistics, experienced a surge, reaching its zenith in 2022 with $6.26 billion. However, 2023 saw a slight dip for Old Dominion, indicating potential market challenges or strategic shifts.
While Lennox International maintained consistent growth, Old Dominion's fluctuating figures suggest a dynamic market presence. As we look to the future, these trends offer valuable insights into the evolving industrial landscape.
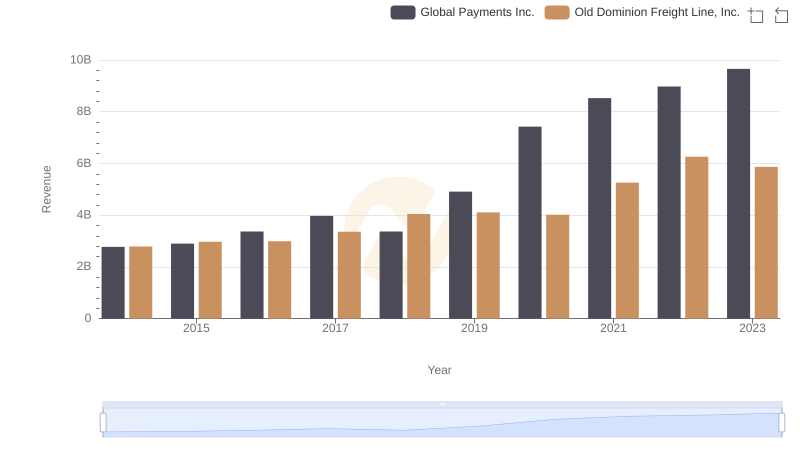
Comparing Revenue Performance: Old Dominion Freight Line, Inc. or Global Payments Inc.?
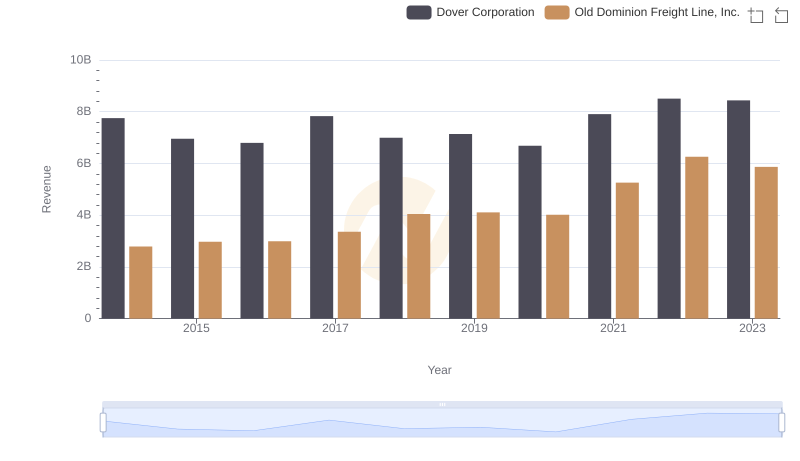
Old Dominion Freight Line, Inc. vs Dover Corporation: Examining Key Revenue Metrics
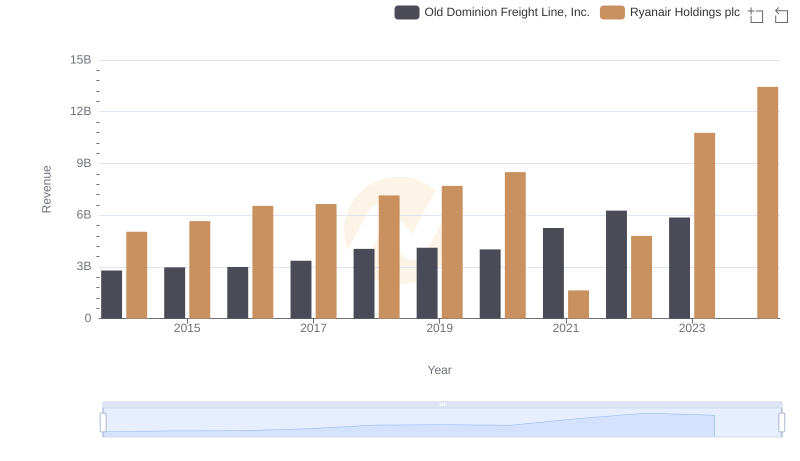
Old Dominion Freight Line, Inc. vs Ryanair Holdings plc: Examining Key Revenue Metrics
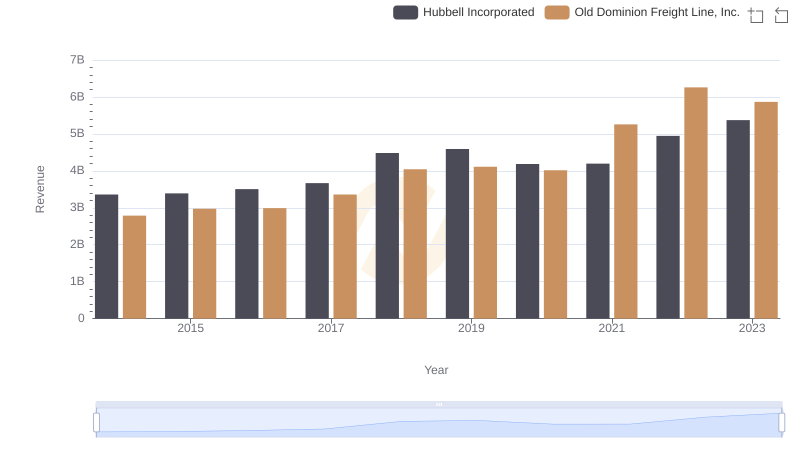
Old Dominion Freight Line, Inc. or Hubbell Incorporated: Who Leads in Yearly Revenue?
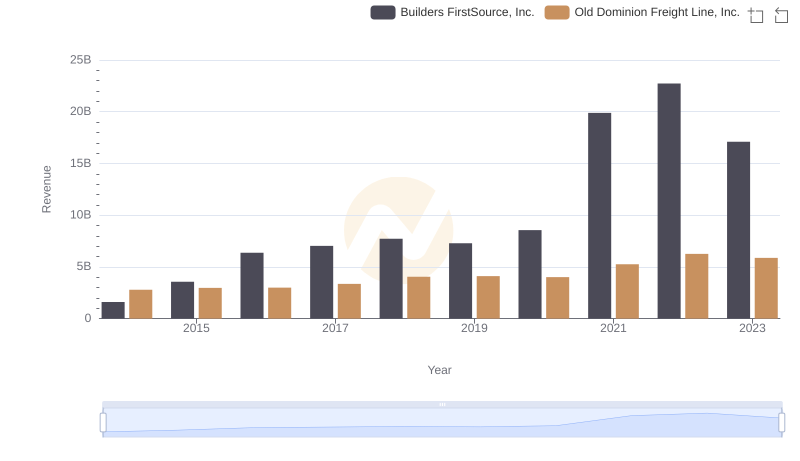
Comparing Revenue Performance: Old Dominion Freight Line, Inc. or Builders FirstSource, Inc.?
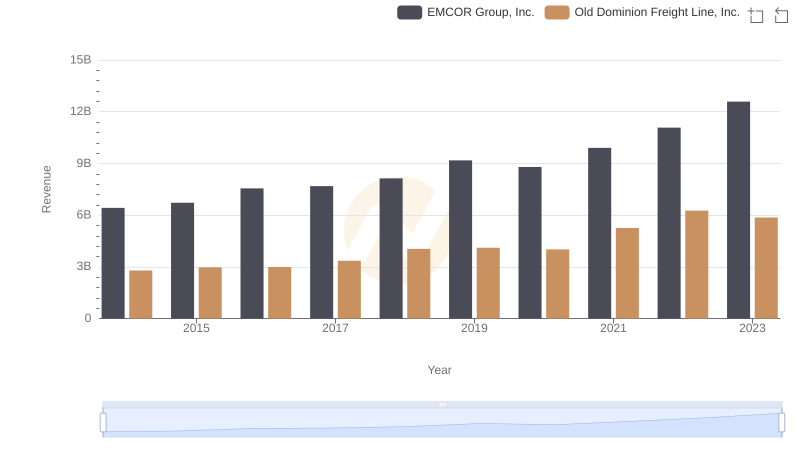
Who Generates More Revenue? Old Dominion Freight Line, Inc. or EMCOR Group, Inc.
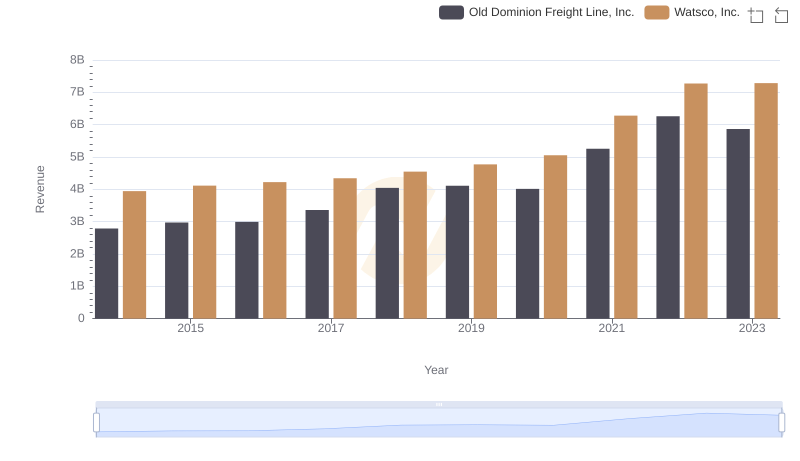
Revenue Showdown: Old Dominion Freight Line, Inc. vs Watsco, Inc.
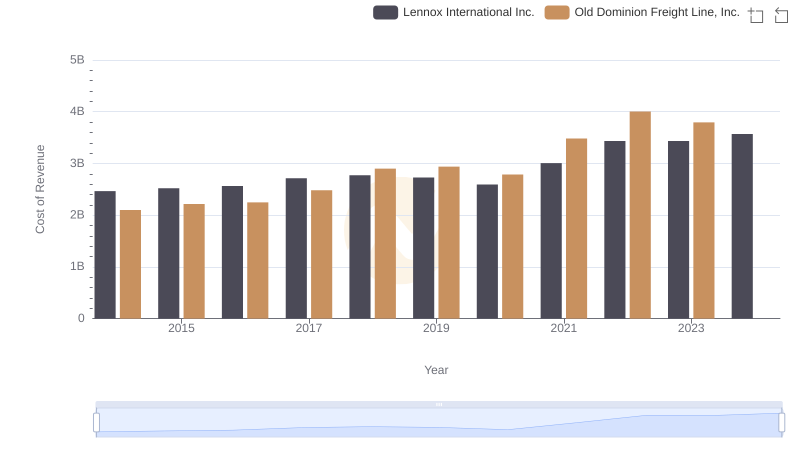
Cost of Revenue Comparison: Old Dominion Freight Line, Inc. vs Lennox International Inc.
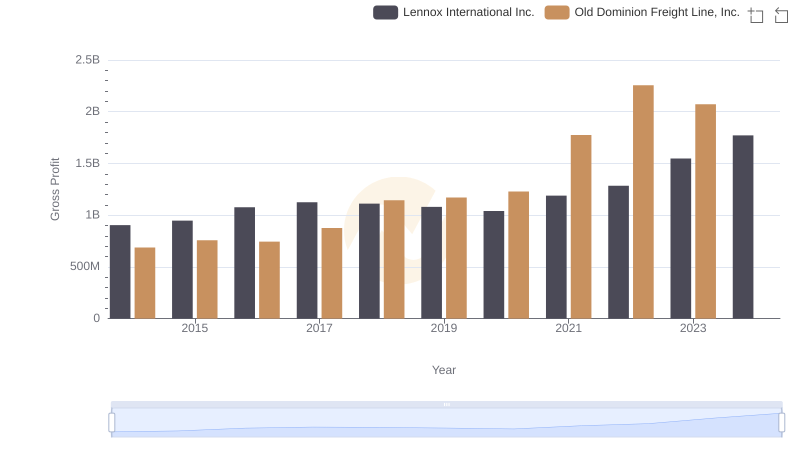
Gross Profit Analysis: Comparing Old Dominion Freight Line, Inc. and Lennox International Inc.
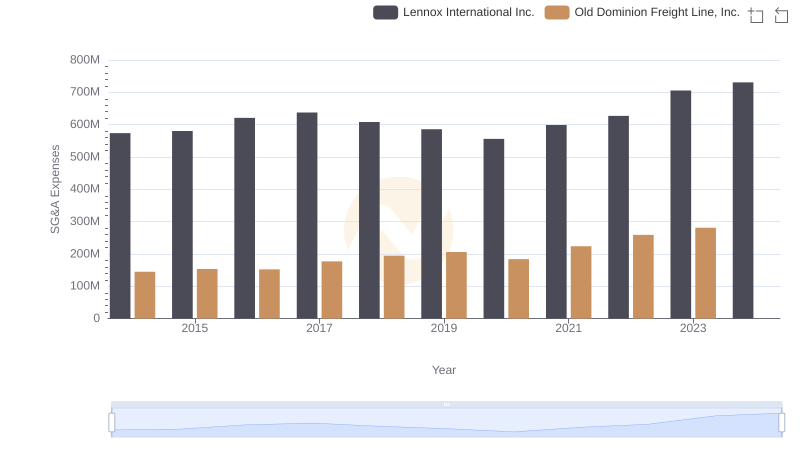
Breaking Down SG&A Expenses: Old Dominion Freight Line, Inc. vs Lennox International Inc.