| __timestamp | Hubbell Incorporated | Old Dominion Freight Line, Inc. |
|---|---|---|
| Wednesday, January 1, 2014 | 2250400000 | 2100409000 |
| Thursday, January 1, 2015 | 2298600000 | 2214943000 |
| Friday, January 1, 2016 | 2404500000 | 2246890000 |
| Sunday, January 1, 2017 | 2516900000 | 2482732000 |
| Monday, January 1, 2018 | 3181300000 | 2899452000 |
| Tuesday, January 1, 2019 | 3238300000 | 2938895000 |
| Wednesday, January 1, 2020 | 2976700000 | 2786531000 |
| Friday, January 1, 2021 | 3042600000 | 3481268000 |
| Saturday, January 1, 2022 | 3476300000 | 4003951000 |
| Sunday, January 1, 2023 | 3484800000 | 3793953000 |
| Monday, January 1, 2024 | 3724400000 |
Infusing magic into the data realm
In the ever-evolving landscape of American industry, understanding cost dynamics is crucial. From 2014 to 2023, Old Dominion Freight Line, Inc. and Hubbell Incorporated have shown intriguing trends in their cost of revenue. Old Dominion Freight Line, Inc. has seen a remarkable 80% increase in its cost of revenue, peaking in 2022. This reflects its aggressive expansion and operational scaling. Meanwhile, Hubbell Incorporated experienced a 55% rise, with a notable spike in 2018, indicating strategic investments in its core operations. Both companies faced a dip in 2020, likely due to global disruptions, but rebounded strongly in subsequent years. These insights highlight the resilience and strategic maneuvers of these industry giants, offering a window into their financial health and operational strategies over the past decade.
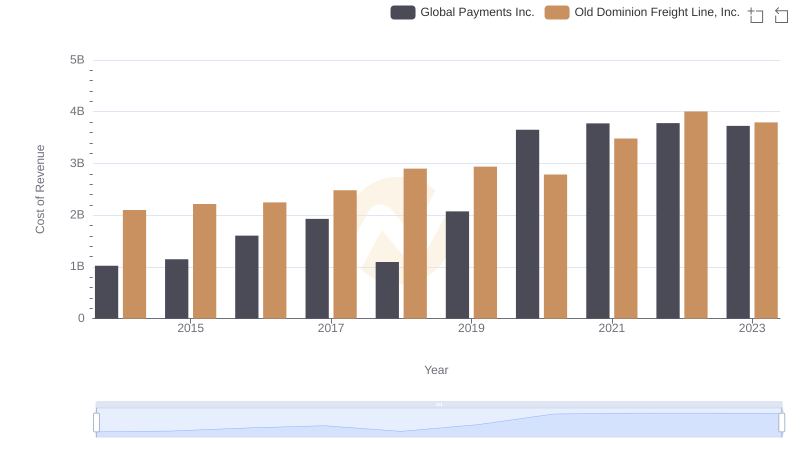
Comparing Cost of Revenue Efficiency: Old Dominion Freight Line, Inc. vs Global Payments Inc.
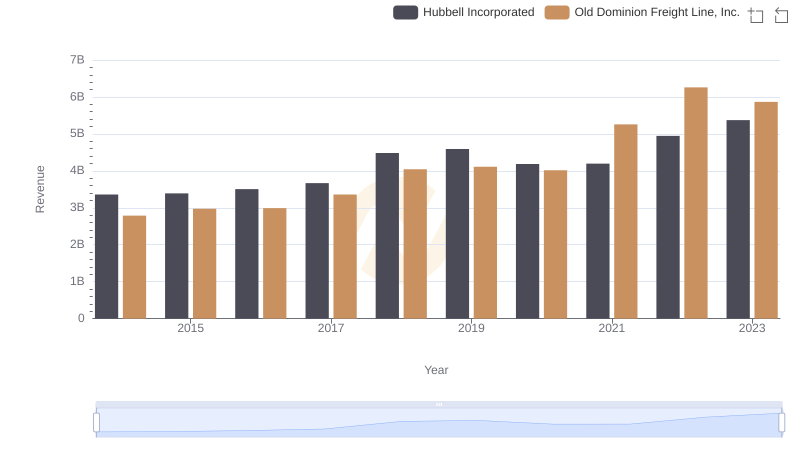
Old Dominion Freight Line, Inc. or Hubbell Incorporated: Who Leads in Yearly Revenue?
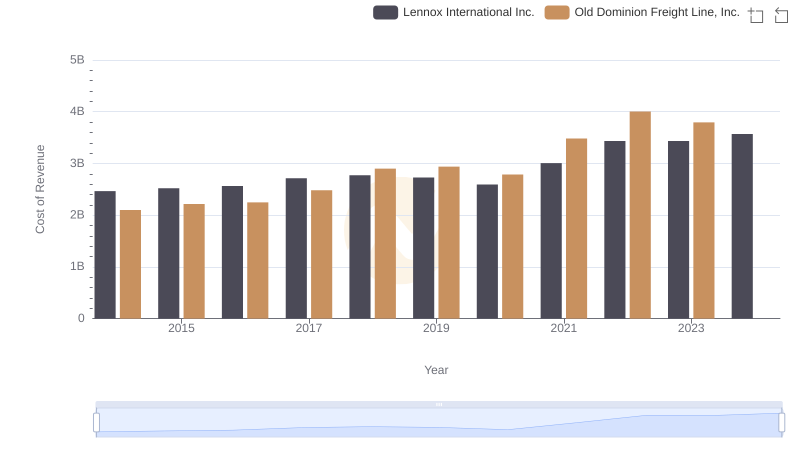
Cost of Revenue Comparison: Old Dominion Freight Line, Inc. vs Lennox International Inc.
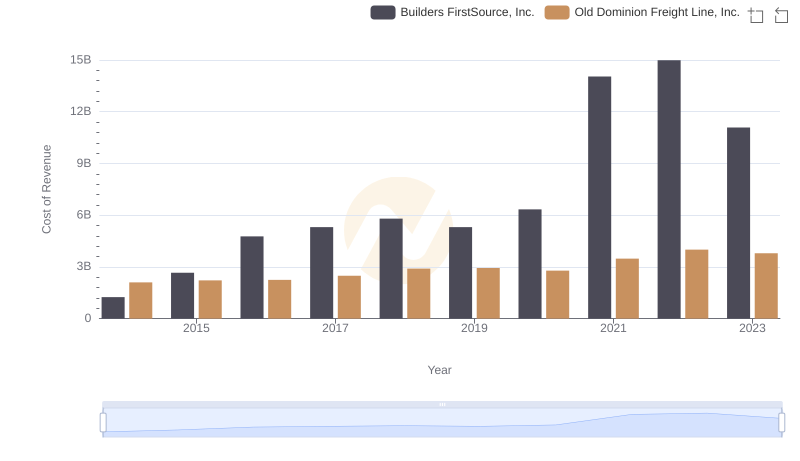
Cost Insights: Breaking Down Old Dominion Freight Line, Inc. and Builders FirstSource, Inc.'s Expenses
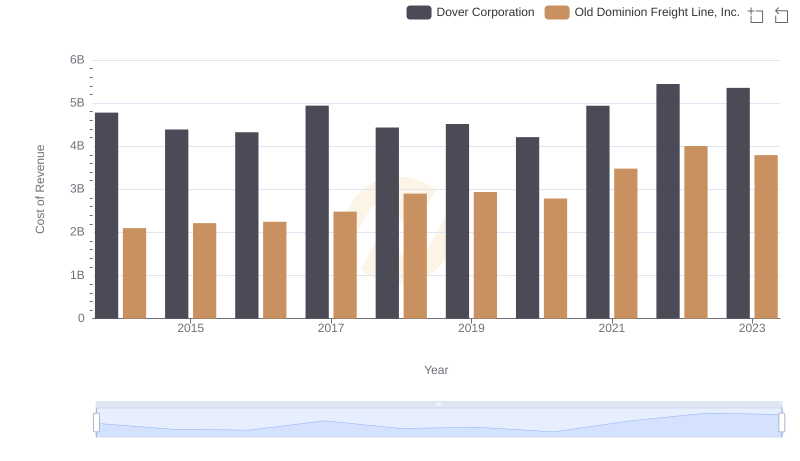
Cost of Revenue Comparison: Old Dominion Freight Line, Inc. vs Dover Corporation
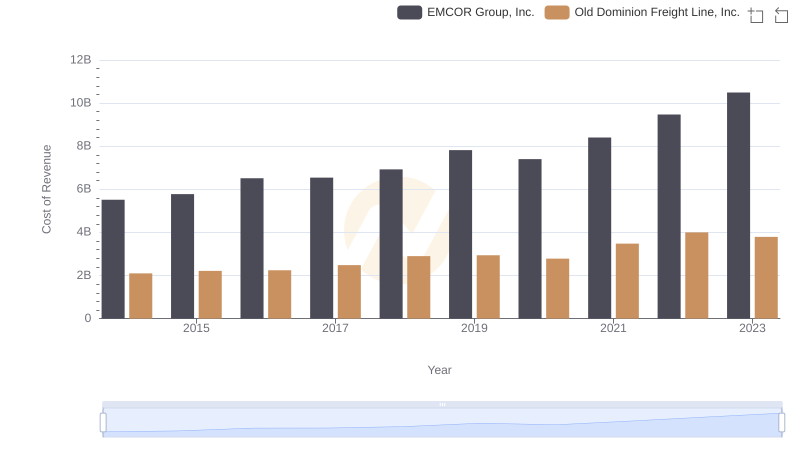
Cost of Revenue Comparison: Old Dominion Freight Line, Inc. vs EMCOR Group, Inc.
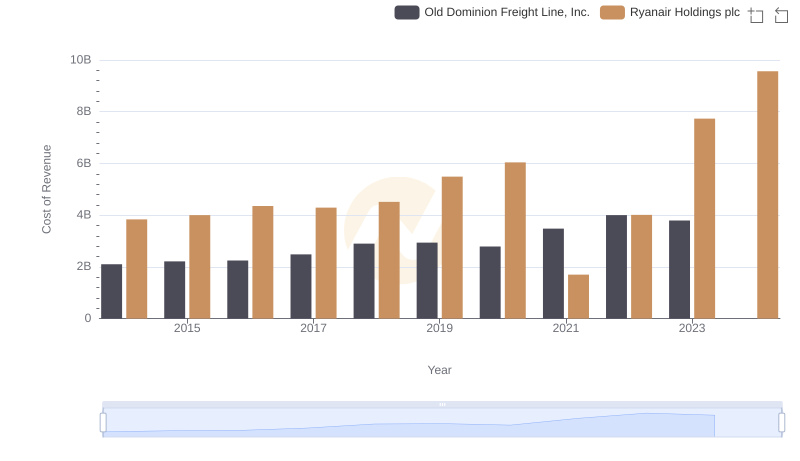
Cost Insights: Breaking Down Old Dominion Freight Line, Inc. and Ryanair Holdings plc's Expenses
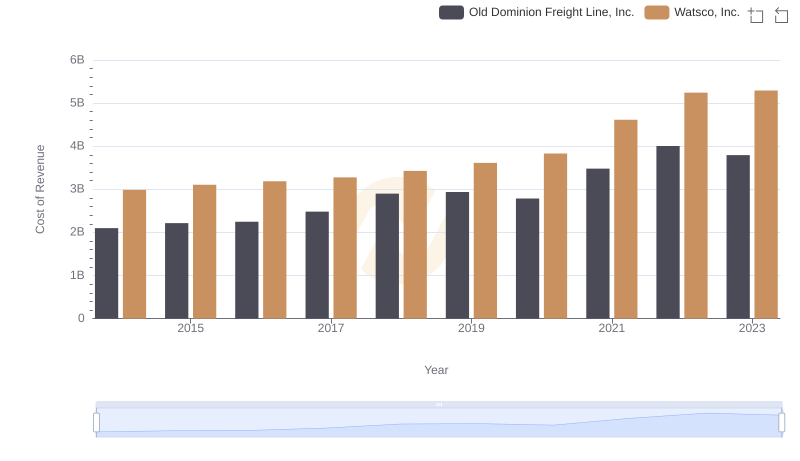
Cost of Revenue Trends: Old Dominion Freight Line, Inc. vs Watsco, Inc.
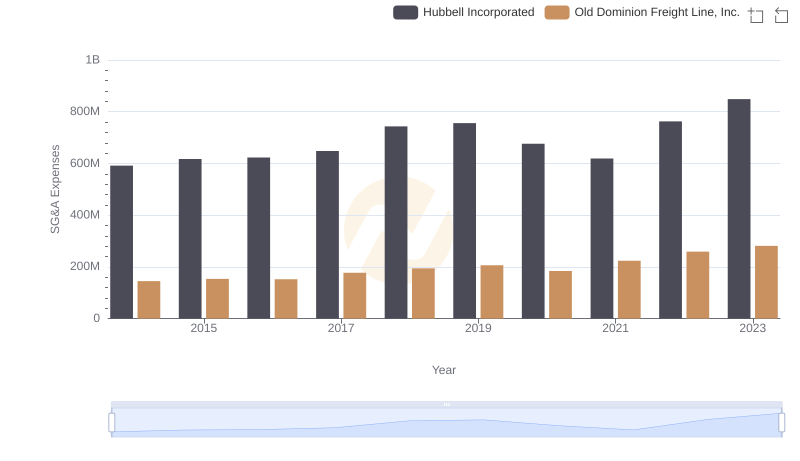
SG&A Efficiency Analysis: Comparing Old Dominion Freight Line, Inc. and Hubbell Incorporated
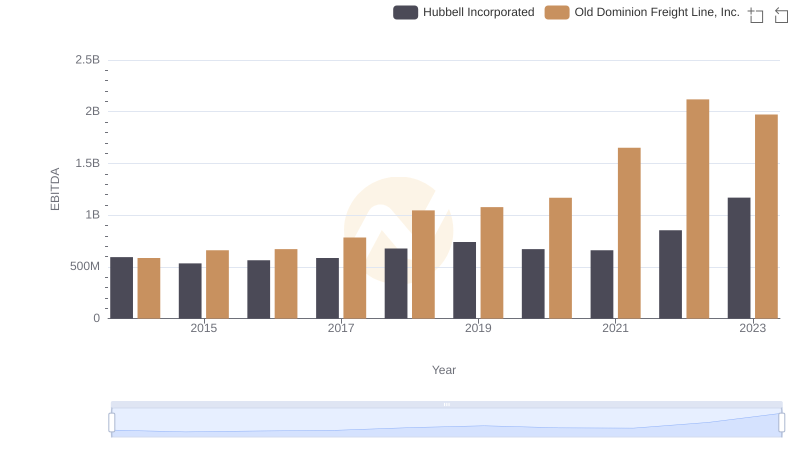
Comprehensive EBITDA Comparison: Old Dominion Freight Line, Inc. vs Hubbell Incorporated