| __timestamp | Lennox International Inc. | Old Dominion Freight Line, Inc. |
|---|---|---|
| Wednesday, January 1, 2014 | 903300000 | 687488000 |
| Thursday, January 1, 2015 | 947400000 | 757499000 |
| Friday, January 1, 2016 | 1076500000 | 744627000 |
| Sunday, January 1, 2017 | 1125200000 | 875380000 |
| Monday, January 1, 2018 | 1111200000 | 1144243000 |
| Tuesday, January 1, 2019 | 1079800000 | 1170216000 |
| Wednesday, January 1, 2020 | 1040100000 | 1228598000 |
| Friday, January 1, 2021 | 1188400000 | 1775060000 |
| Saturday, January 1, 2022 | 1284700000 | 2256126000 |
| Sunday, January 1, 2023 | 1547800000 | 2072199000 |
| Monday, January 1, 2024 | 1771900000 |
Unveiling the hidden dimensions of data
In the competitive landscape of American industry, Old Dominion Freight Line, Inc. and Lennox International Inc. have emerged as leaders in their respective sectors. Over the past decade, these companies have demonstrated remarkable growth in gross profit, reflecting their strategic prowess and market adaptability.
From 2014 to 2023, Lennox International Inc. saw its gross profit increase by approximately 96%, showcasing its resilience and innovation in the HVAC industry. Meanwhile, Old Dominion Freight Line, Inc. experienced a staggering 201% growth in gross profit, underscoring its dominance in the freight and logistics sector.
In 2023, Lennox International Inc. achieved a gross profit of $1.55 billion, while Old Dominion Freight Line, Inc. reached $2.07 billion. However, data for 2024 is incomplete for Old Dominion, indicating potential fluctuations or reporting delays.
These trends highlight the dynamic nature of these industries and the companies' ability to navigate economic challenges.
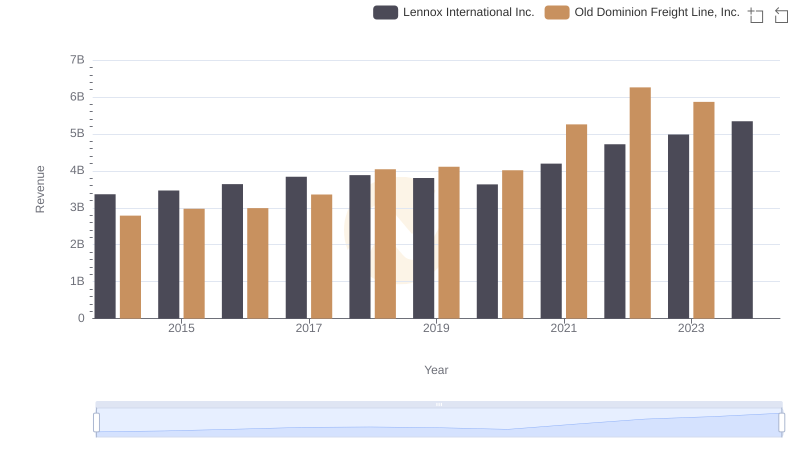
Old Dominion Freight Line, Inc. vs Lennox International Inc.: Annual Revenue Growth Compared
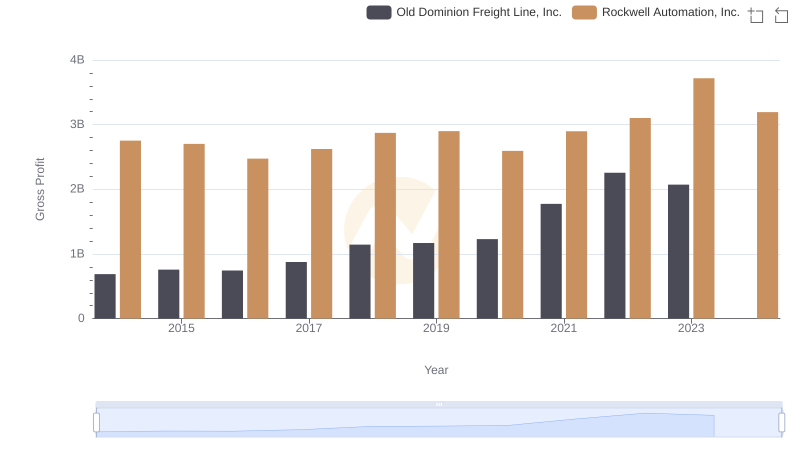
Key Insights on Gross Profit: Old Dominion Freight Line, Inc. vs Rockwell Automation, Inc.
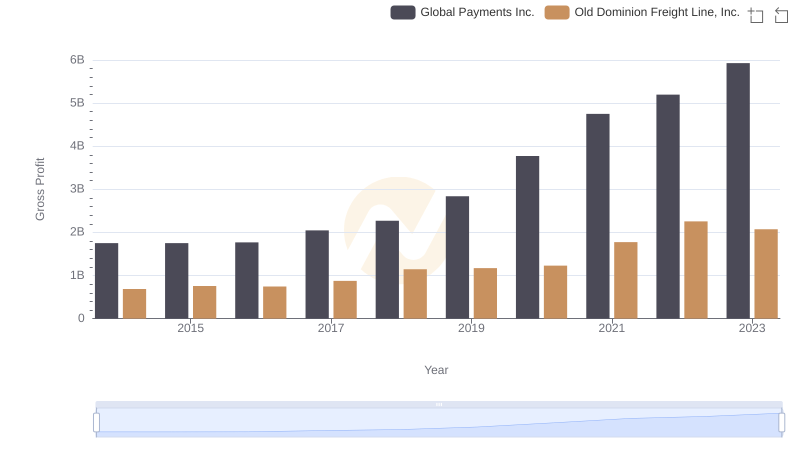
Who Generates Higher Gross Profit? Old Dominion Freight Line, Inc. or Global Payments Inc.
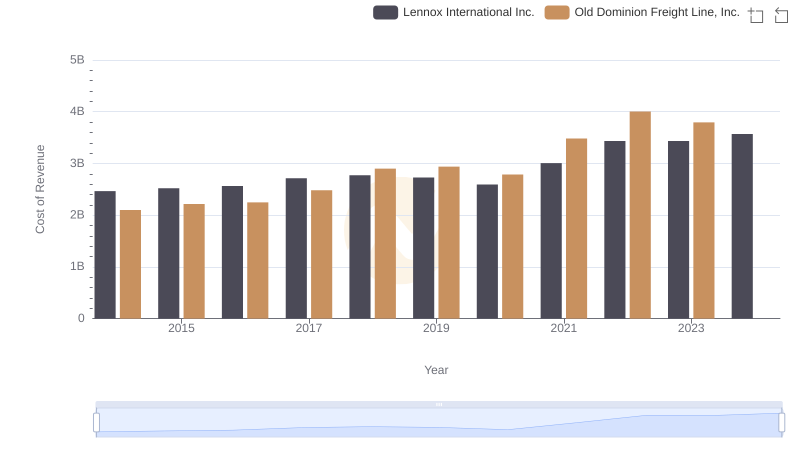
Cost of Revenue Comparison: Old Dominion Freight Line, Inc. vs Lennox International Inc.

Old Dominion Freight Line, Inc. and HEICO Corporation: A Detailed Gross Profit Analysis
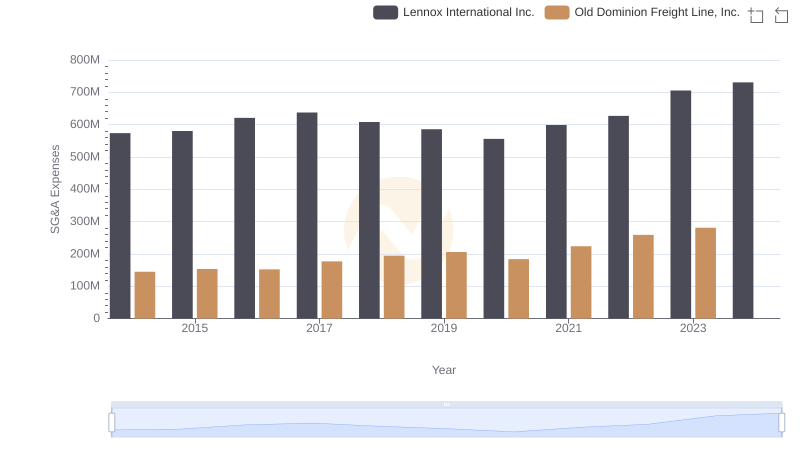
Breaking Down SG&A Expenses: Old Dominion Freight Line, Inc. vs Lennox International Inc.