| __timestamp | Lennox International Inc. | Old Dominion Freight Line, Inc. |
|---|---|---|
| Wednesday, January 1, 2014 | 573700000 | 144817000 |
| Thursday, January 1, 2015 | 580500000 | 153589000 |
| Friday, January 1, 2016 | 621000000 | 152391000 |
| Sunday, January 1, 2017 | 637700000 | 177205000 |
| Monday, January 1, 2018 | 608200000 | 194368000 |
| Tuesday, January 1, 2019 | 585900000 | 206125000 |
| Wednesday, January 1, 2020 | 555900000 | 184185000 |
| Friday, January 1, 2021 | 598900000 | 223757000 |
| Saturday, January 1, 2022 | 627200000 | 258883000 |
| Sunday, January 1, 2023 | 705500000 | 281053000 |
| Monday, January 1, 2024 | 730600000 |
Data in motion
In the ever-evolving landscape of corporate finance, understanding the nuances of Selling, General, and Administrative (SG&A) expenses is crucial. Over the past decade, Lennox International Inc. has consistently outpaced Old Dominion Freight Line, Inc. in SG&A expenditures. From 2014 to 2023, Lennox's SG&A expenses grew by approximately 28%, peaking in 2023. In contrast, Old Dominion's expenses increased by nearly 94% over the same period, reflecting a more aggressive expansion strategy.
Interestingly, 2024 data for Old Dominion is missing, leaving room for speculation on their financial trajectory. This comparison highlights the strategic differences between the two companies: Lennox's steady growth versus Old Dominion's rapid scaling. As businesses navigate the complexities of financial management, these insights offer a window into the strategic priorities shaping their futures.
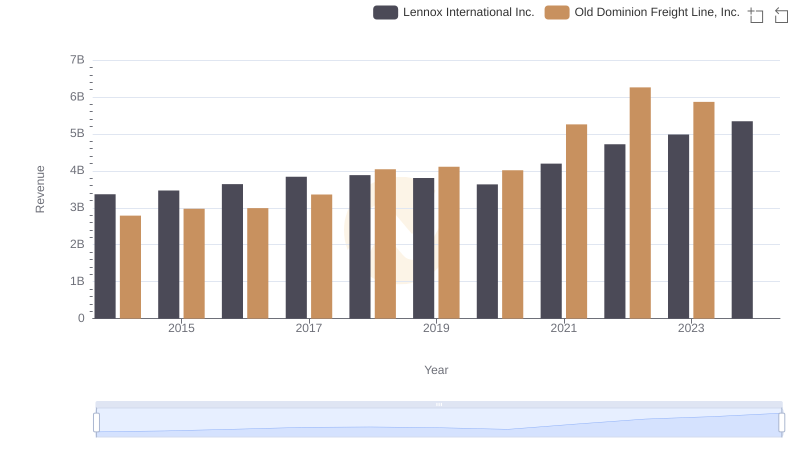
Old Dominion Freight Line, Inc. vs Lennox International Inc.: Annual Revenue Growth Compared
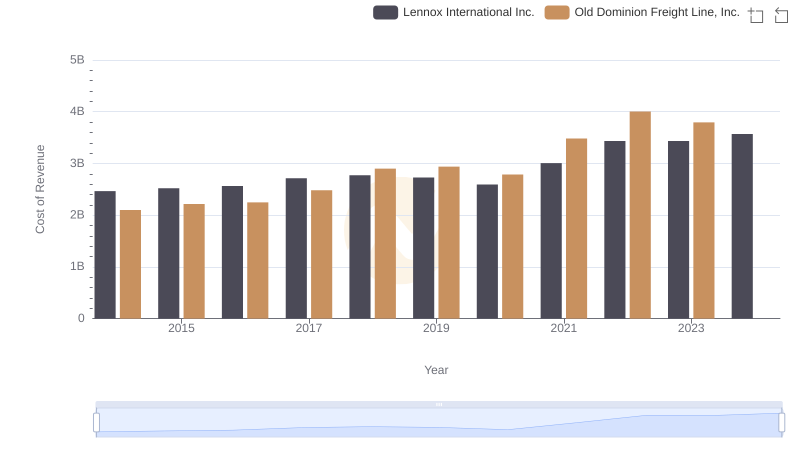
Cost of Revenue Comparison: Old Dominion Freight Line, Inc. vs Lennox International Inc.
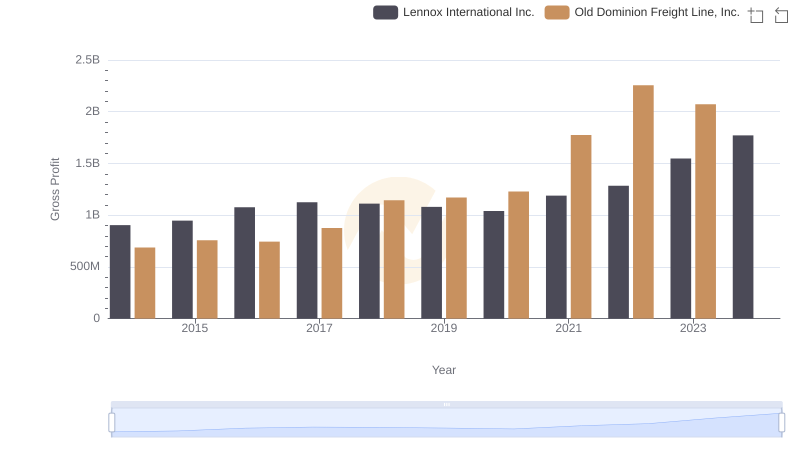
Gross Profit Analysis: Comparing Old Dominion Freight Line, Inc. and Lennox International Inc.
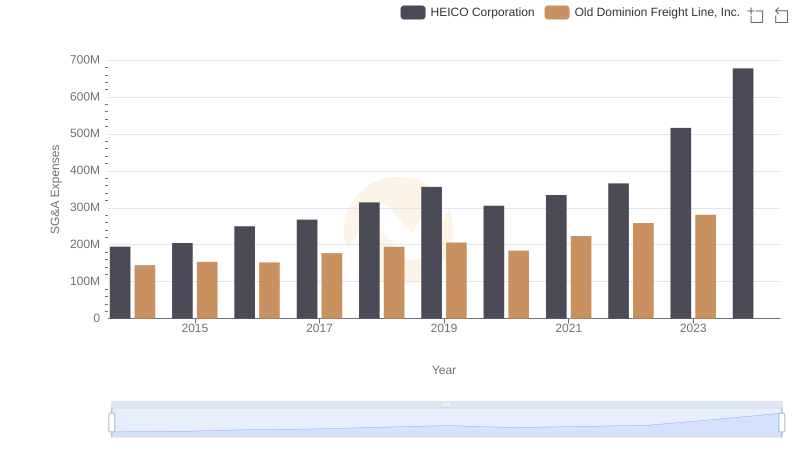
Selling, General, and Administrative Costs: Old Dominion Freight Line, Inc. vs HEICO Corporation
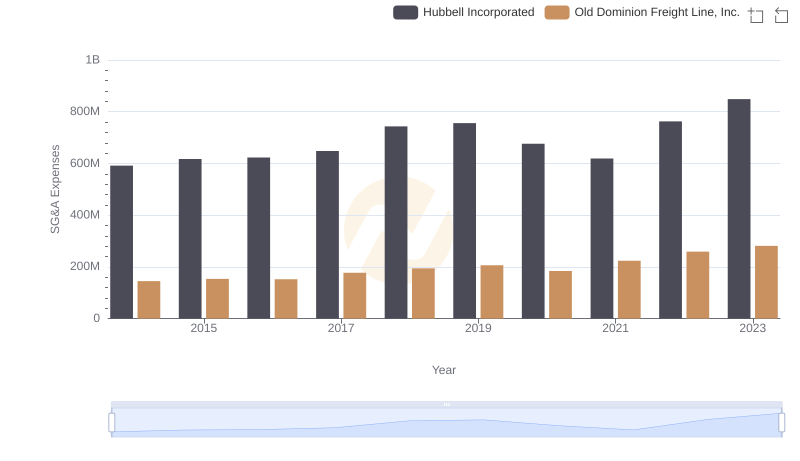
SG&A Efficiency Analysis: Comparing Old Dominion Freight Line, Inc. and Hubbell Incorporated
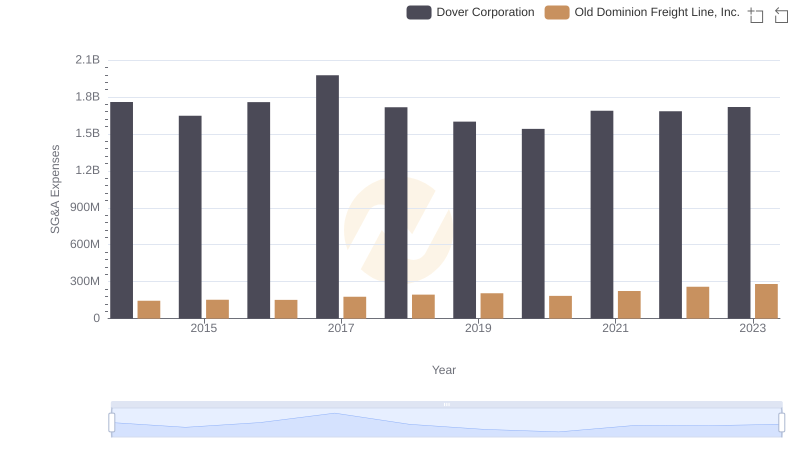
Old Dominion Freight Line, Inc. vs Dover Corporation: SG&A Expense Trends
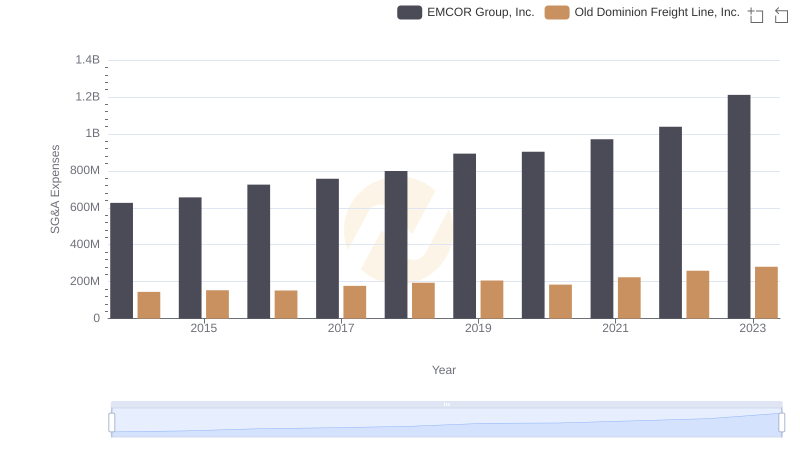
Old Dominion Freight Line, Inc. vs EMCOR Group, Inc.: SG&A Expense Trends

Selling, General, and Administrative Costs: Old Dominion Freight Line, Inc. vs Watsco, Inc.