| __timestamp | Old Dominion Freight Line, Inc. | Watsco, Inc. |
|---|---|---|
| Wednesday, January 1, 2014 | 2100409000 | 2988138000 |
| Thursday, January 1, 2015 | 2214943000 | 3105882000 |
| Friday, January 1, 2016 | 2246890000 | 3186118000 |
| Sunday, January 1, 2017 | 2482732000 | 3276296000 |
| Monday, January 1, 2018 | 2899452000 | 3426401000 |
| Tuesday, January 1, 2019 | 2938895000 | 3613406000 |
| Wednesday, January 1, 2020 | 2786531000 | 3832107000 |
| Friday, January 1, 2021 | 3481268000 | 4612647000 |
| Saturday, January 1, 2022 | 4003951000 | 5244055000 |
| Sunday, January 1, 2023 | 3793953000 | 5291627000 |
| Monday, January 1, 2024 | 5573604000 |
Unlocking the unknown
In the competitive landscape of the logistics and distribution industry, Old Dominion Freight Line, Inc. and Watsco, Inc. have shown remarkable trajectories in their cost of revenue over the past decade. From 2014 to 2023, Old Dominion Freight Line, Inc. saw a steady increase, peaking in 2022 with a 90% rise from its 2014 figures. However, 2023 marked a slight dip, bringing it down by 5% from the previous year. Meanwhile, Watsco, Inc. consistently outpaced its counterpart, with a 77% increase over the same period, culminating in 2023 with its highest recorded cost of revenue. This trend highlights Watsco's robust growth strategy and market adaptation. As these companies navigate the complexities of their respective markets, their cost of revenue trends offer valuable insights into their operational efficiencies and strategic priorities.
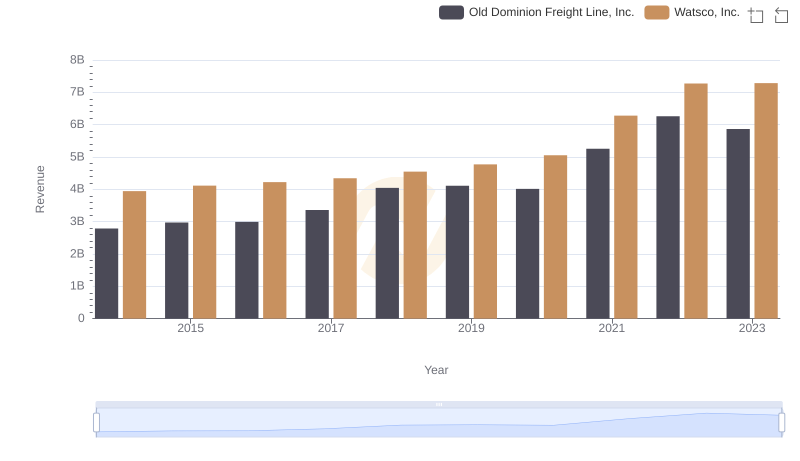
Revenue Showdown: Old Dominion Freight Line, Inc. vs Watsco, Inc.
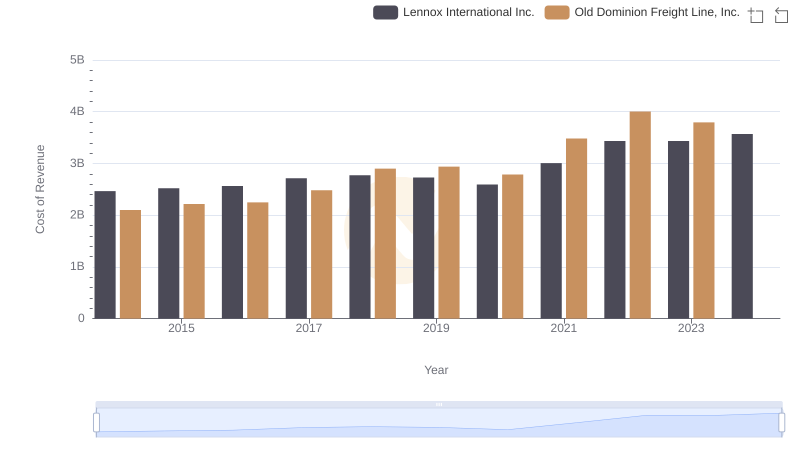
Cost of Revenue Comparison: Old Dominion Freight Line, Inc. vs Lennox International Inc.
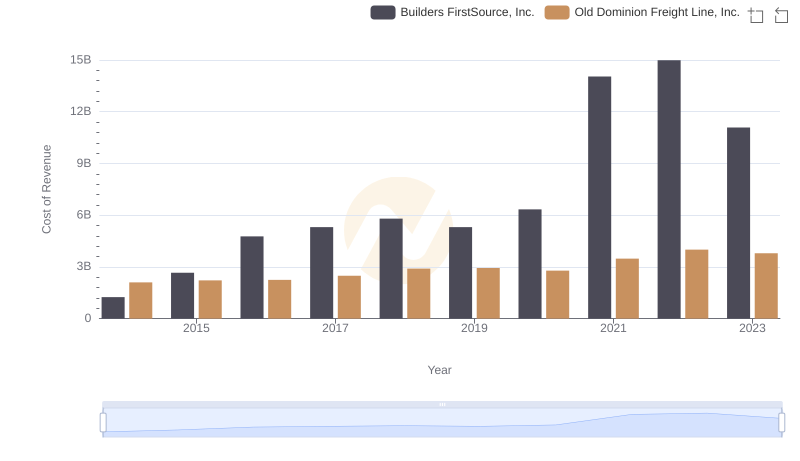
Cost Insights: Breaking Down Old Dominion Freight Line, Inc. and Builders FirstSource, Inc.'s Expenses
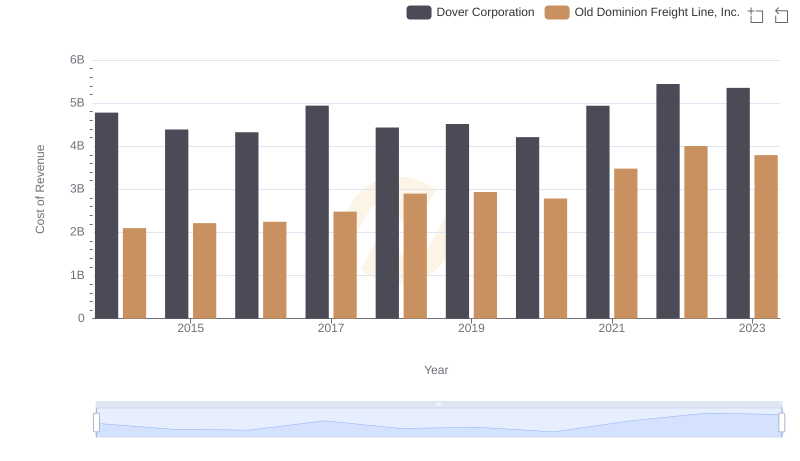
Cost of Revenue Comparison: Old Dominion Freight Line, Inc. vs Dover Corporation
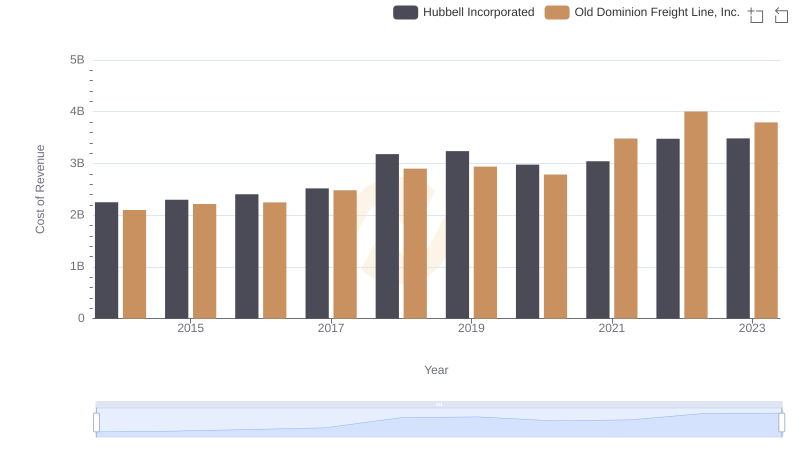
Cost of Revenue: Key Insights for Old Dominion Freight Line, Inc. and Hubbell Incorporated
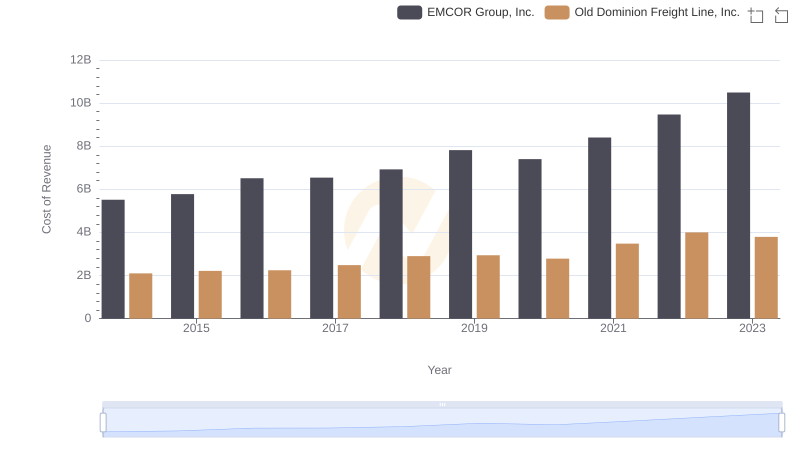
Cost of Revenue Comparison: Old Dominion Freight Line, Inc. vs EMCOR Group, Inc.
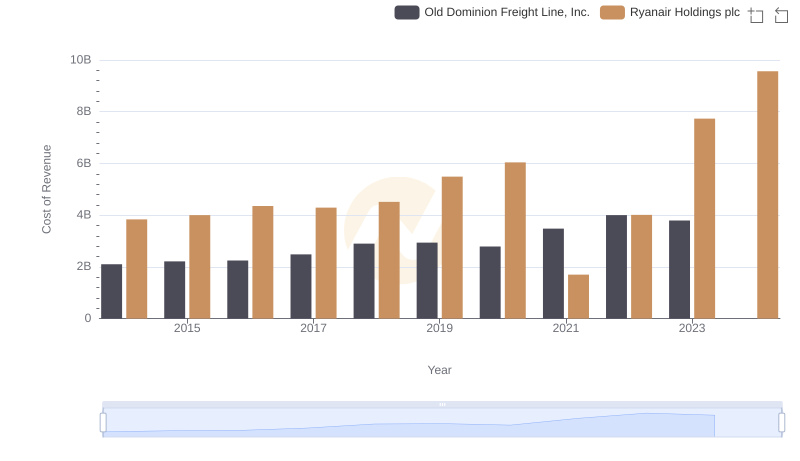
Cost Insights: Breaking Down Old Dominion Freight Line, Inc. and Ryanair Holdings plc's Expenses

Selling, General, and Administrative Costs: Old Dominion Freight Line, Inc. vs Watsco, Inc.
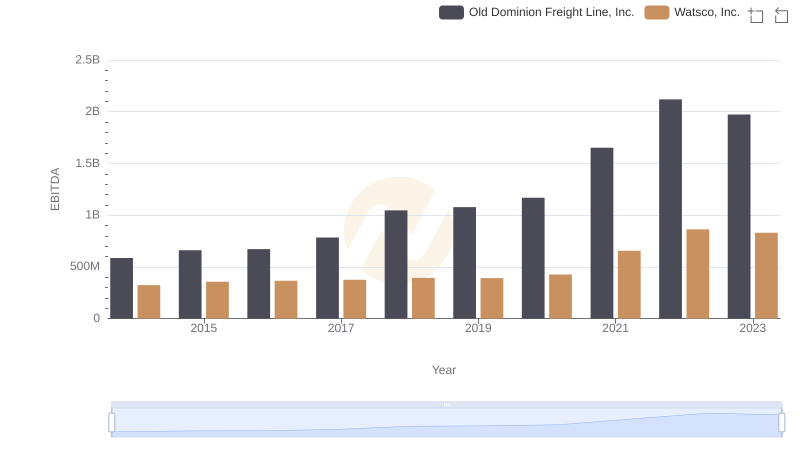
Old Dominion Freight Line, Inc. and Watsco, Inc.: A Detailed Examination of EBITDA Performance