| __timestamp | Builders FirstSource, Inc. | Old Dominion Freight Line, Inc. |
|---|---|---|
| Wednesday, January 1, 2014 | 1247099000 | 2100409000 |
| Thursday, January 1, 2015 | 2662967000 | 2214943000 |
| Friday, January 1, 2016 | 4770536000 | 2246890000 |
| Sunday, January 1, 2017 | 5306818000 | 2482732000 |
| Monday, January 1, 2018 | 5801831000 | 2899452000 |
| Tuesday, January 1, 2019 | 5303602000 | 2938895000 |
| Wednesday, January 1, 2020 | 6336290000 | 2786531000 |
| Friday, January 1, 2021 | 14042900000 | 3481268000 |
| Saturday, January 1, 2022 | 14982039000 | 4003951000 |
| Sunday, January 1, 2023 | 11084996000 | 3793953000 |
Unlocking the unknown
In the ever-evolving landscape of logistics and construction, understanding cost dynamics is crucial. Old Dominion Freight Line, Inc. and Builders FirstSource, Inc. have shown distinct trends in their cost of revenue over the past decade. From 2014 to 2023, Builders FirstSource, Inc. experienced a staggering 788% increase in costs, peaking in 2022. Meanwhile, Old Dominion Freight Line, Inc. saw a more modest 90% rise, with costs stabilizing around 2023. This divergence highlights the contrasting operational challenges and growth strategies in the freight and construction sectors. Builders FirstSource's costs surged, reflecting its aggressive expansion and market adaptation, while Old Dominion's steady rise underscores its focus on efficiency and service quality. These insights offer a window into the strategic priorities shaping these industries, providing valuable lessons for stakeholders and investors alike.
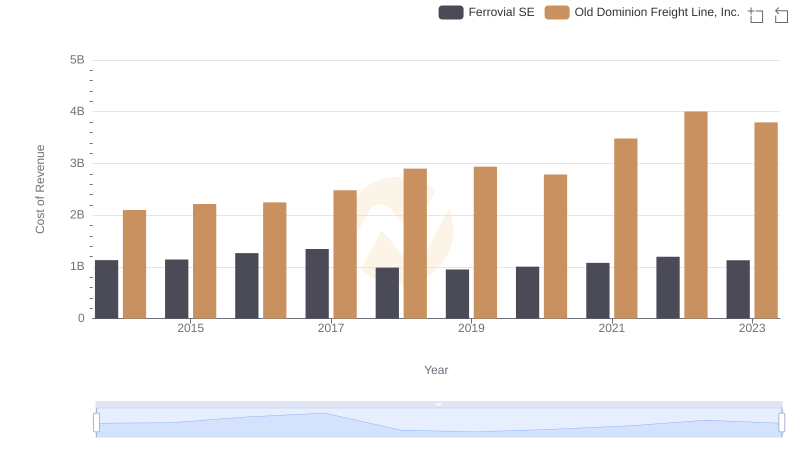
Analyzing Cost of Revenue: Old Dominion Freight Line, Inc. and Ferrovial SE
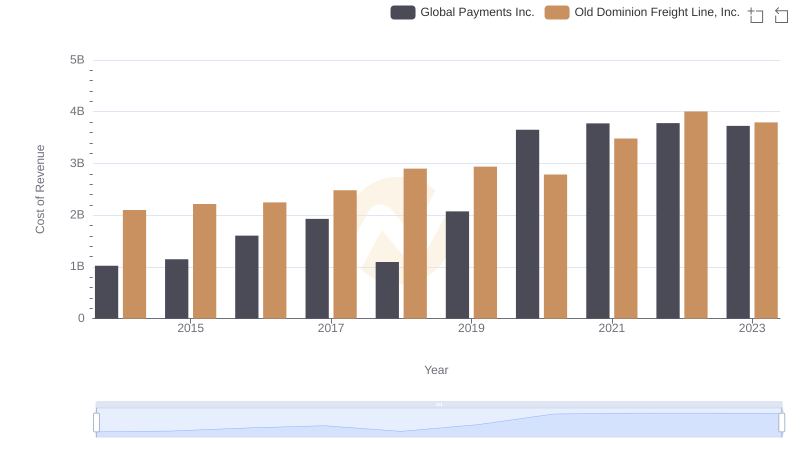
Comparing Cost of Revenue Efficiency: Old Dominion Freight Line, Inc. vs Global Payments Inc.
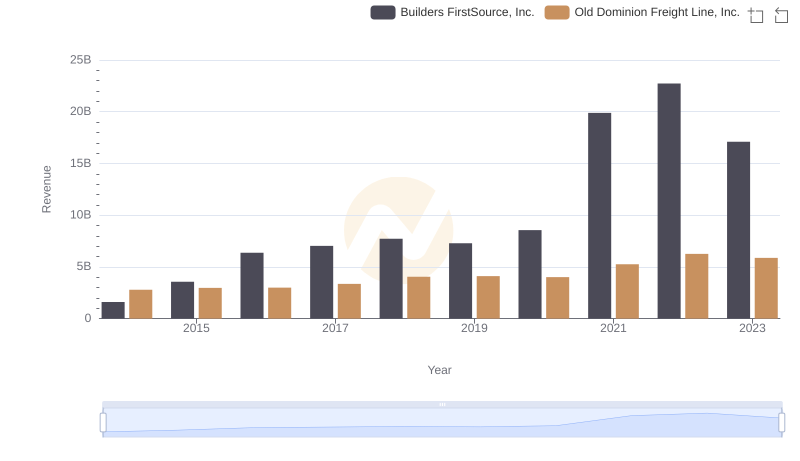
Comparing Revenue Performance: Old Dominion Freight Line, Inc. or Builders FirstSource, Inc.?
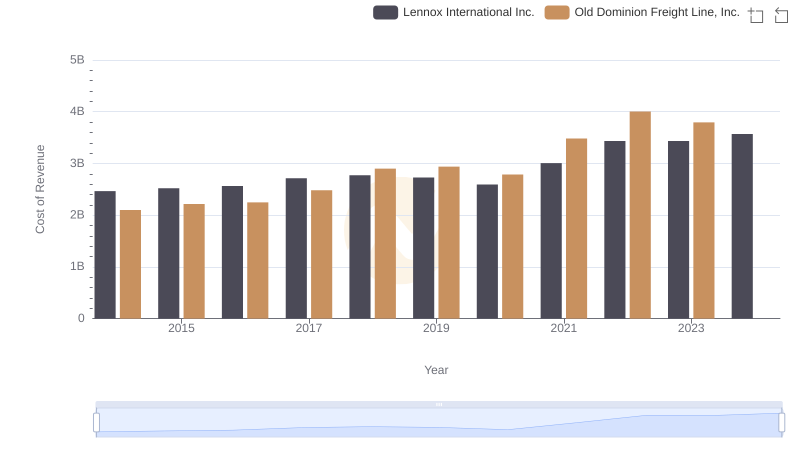
Cost of Revenue Comparison: Old Dominion Freight Line, Inc. vs Lennox International Inc.
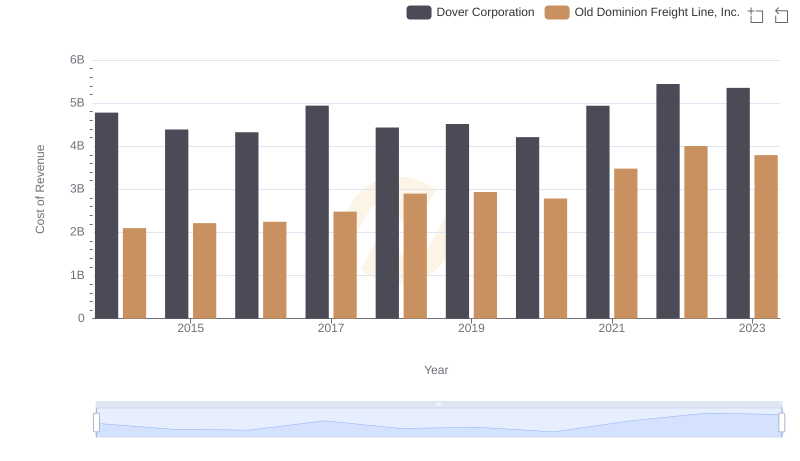
Cost of Revenue Comparison: Old Dominion Freight Line, Inc. vs Dover Corporation
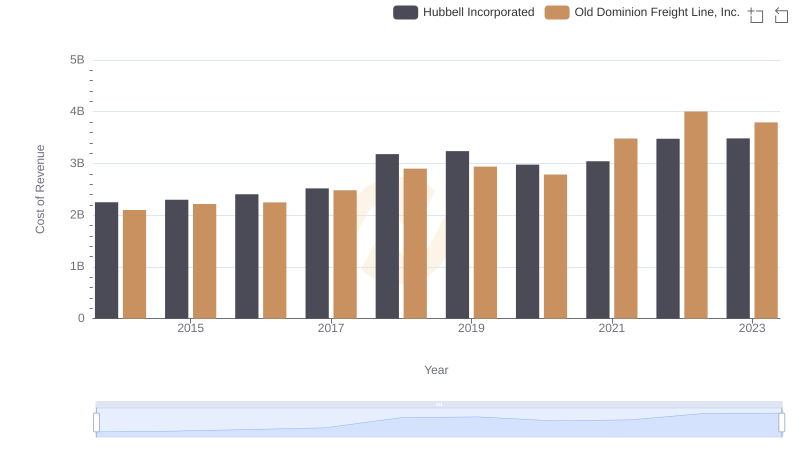
Cost of Revenue: Key Insights for Old Dominion Freight Line, Inc. and Hubbell Incorporated
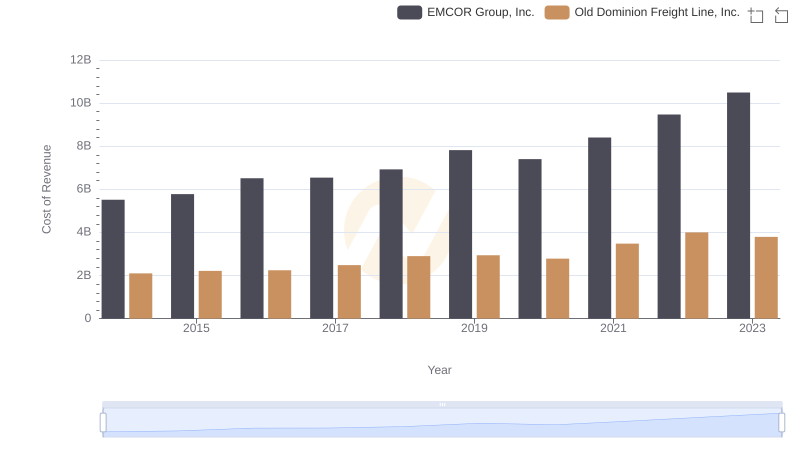
Cost of Revenue Comparison: Old Dominion Freight Line, Inc. vs EMCOR Group, Inc.
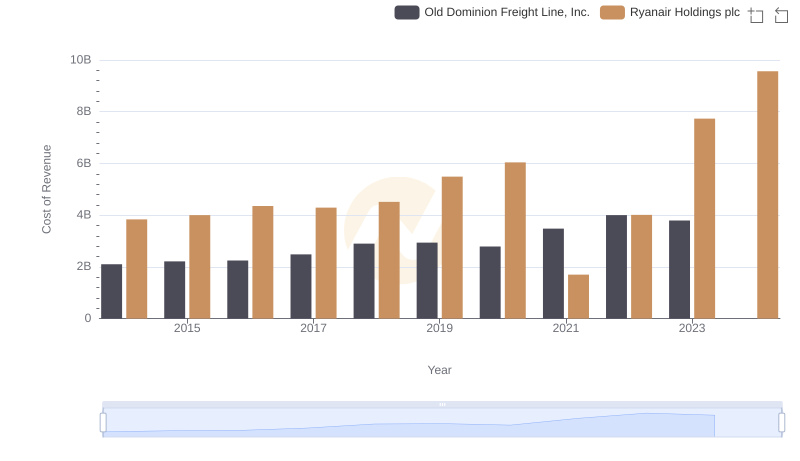
Cost Insights: Breaking Down Old Dominion Freight Line, Inc. and Ryanair Holdings plc's Expenses
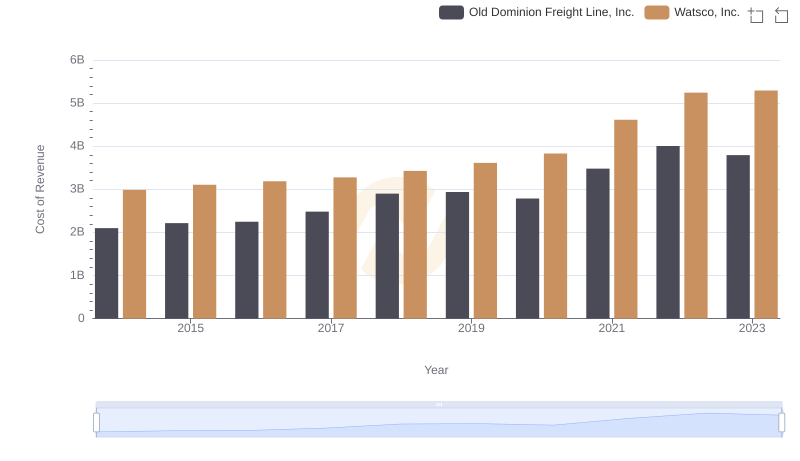
Cost of Revenue Trends: Old Dominion Freight Line, Inc. vs Watsco, Inc.
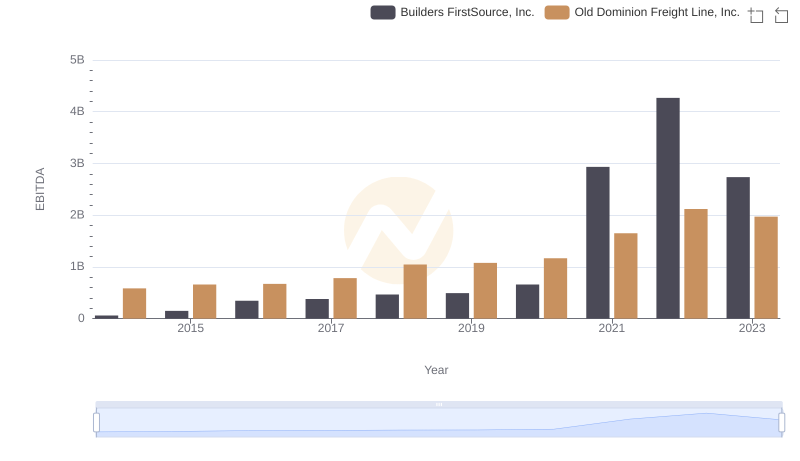
Comprehensive EBITDA Comparison: Old Dominion Freight Line, Inc. vs Builders FirstSource, Inc.