| __timestamp | International Business Machines Corporation | Motorola Solutions, Inc. |
|---|---|---|
| Wednesday, January 1, 2014 | 46386000000 | 3050000000 |
| Thursday, January 1, 2015 | 41057000000 | 2976000000 |
| Friday, January 1, 2016 | 41403000000 | 3169000000 |
| Sunday, January 1, 2017 | 42196000000 | 3356000000 |
| Monday, January 1, 2018 | 42655000000 | 3863000000 |
| Tuesday, January 1, 2019 | 26181000000 | 3956000000 |
| Wednesday, January 1, 2020 | 24314000000 | 3806000000 |
| Friday, January 1, 2021 | 25865000000 | 4131000000 |
| Saturday, January 1, 2022 | 27842000000 | 4883000000 |
| Sunday, January 1, 2023 | 27560000000 | 5008000000 |
| Monday, January 1, 2024 | 27202000000 | 5305000000 |
Igniting the spark of knowledge
In the ever-evolving landscape of technology, understanding the cost dynamics of industry giants like International Business Machines Corporation (IBM) and Motorola Solutions, Inc. is crucial. Over the past decade, IBM's cost of revenue has seen a significant decline, dropping by approximately 41% from 2014 to 2023. This trend reflects IBM's strategic shift towards more efficient operations and a focus on high-margin services. In contrast, Motorola Solutions has experienced a steady increase in its cost of revenue, rising by about 64% over the same period. This growth aligns with Motorola's expansion in public safety and communication solutions, indicating a robust investment in product development and market expansion. The contrasting trajectories of these two companies highlight the diverse strategies employed in the tech sector, offering valuable insights into their operational priorities and market positioning.
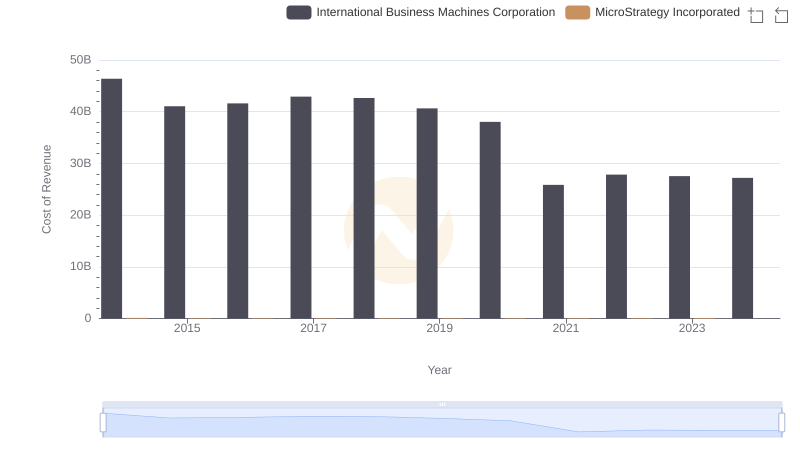
Cost of Revenue: Key Insights for International Business Machines Corporation and MicroStrategy Incorporated
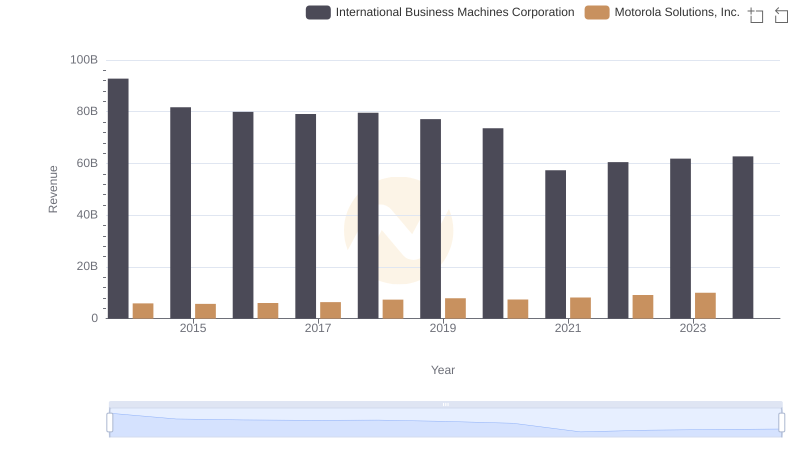
International Business Machines Corporation and Motorola Solutions, Inc.: A Comprehensive Revenue Analysis
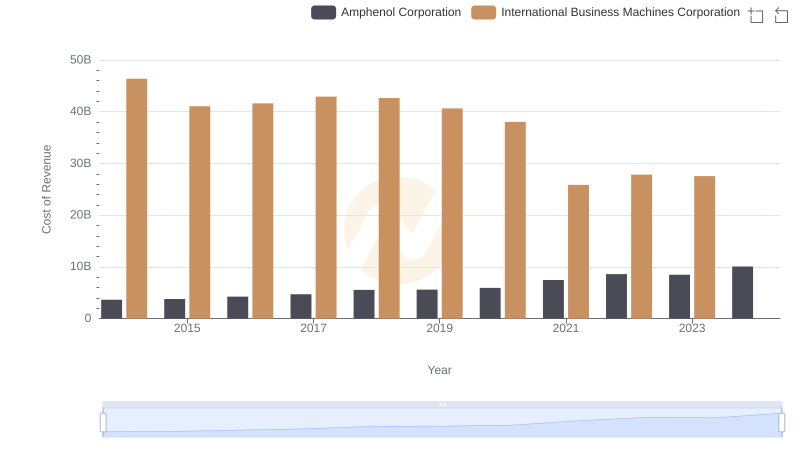
Comparing Cost of Revenue Efficiency: International Business Machines Corporation vs Amphenol Corporation
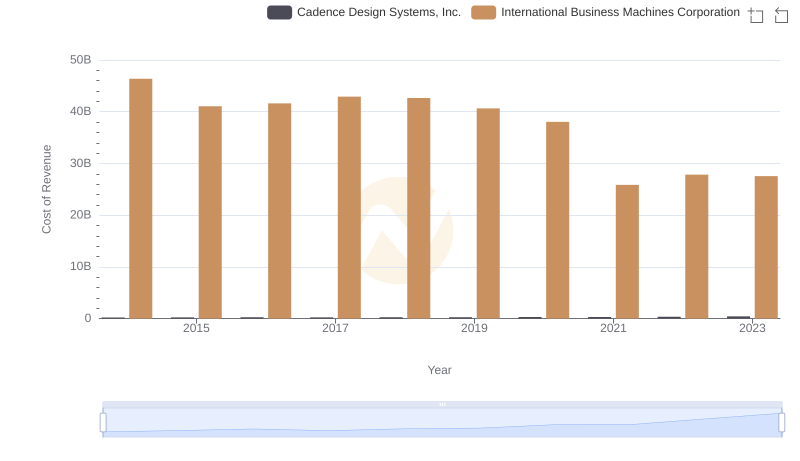
Cost of Revenue Comparison: International Business Machines Corporation vs Cadence Design Systems, Inc.

Cost of Revenue Comparison: International Business Machines Corporation vs Synopsys, Inc.
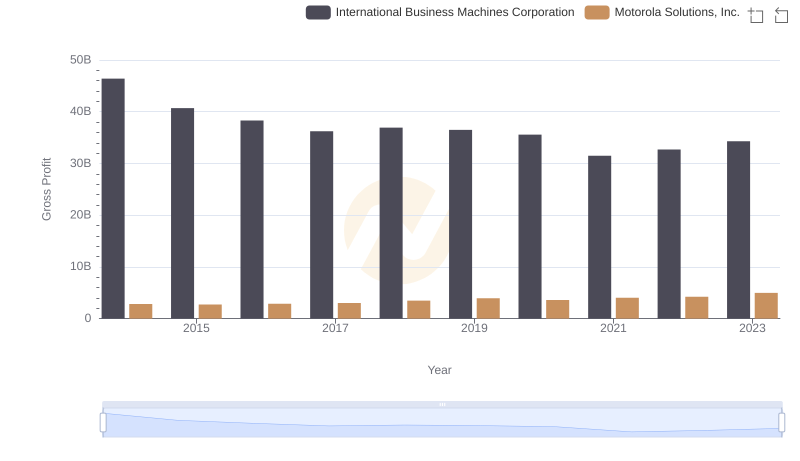
Gross Profit Trends Compared: International Business Machines Corporation vs Motorola Solutions, Inc.
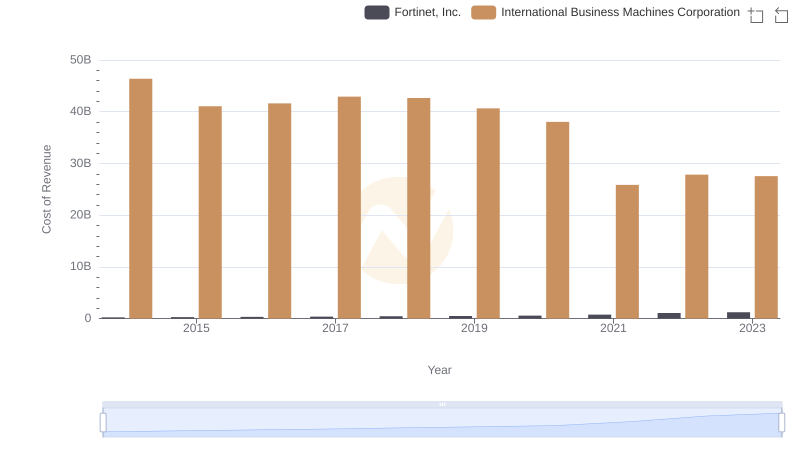
Cost Insights: Breaking Down International Business Machines Corporation and Fortinet, Inc.'s Expenses
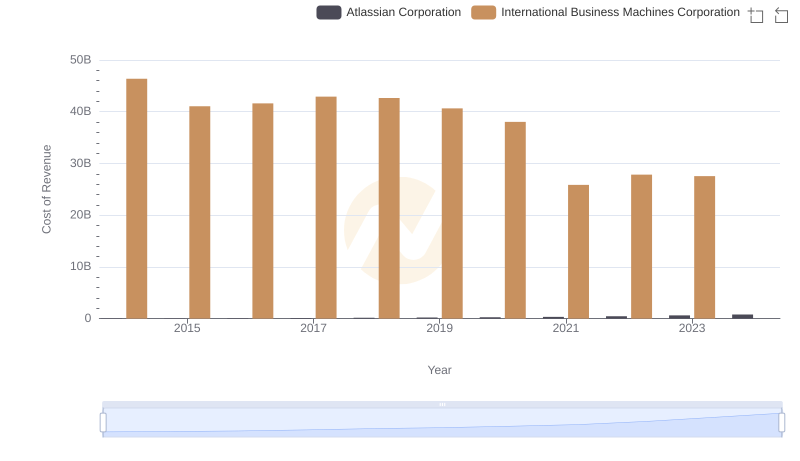
Cost of Revenue: Key Insights for International Business Machines Corporation and Atlassian Corporation
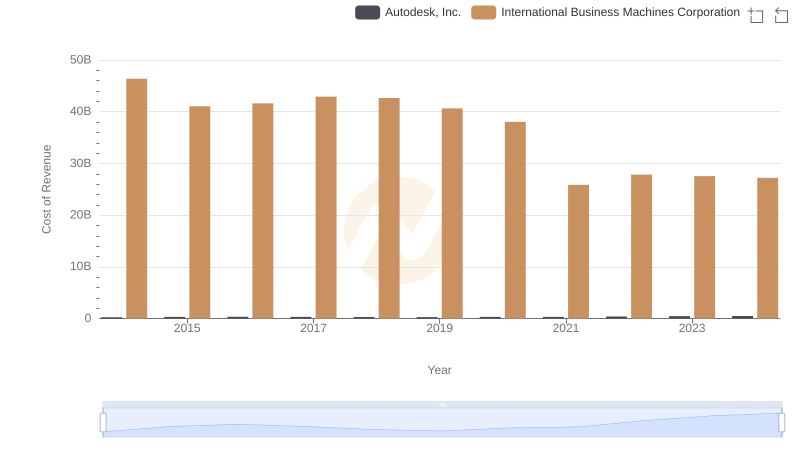
Cost of Revenue Trends: International Business Machines Corporation vs Autodesk, Inc.
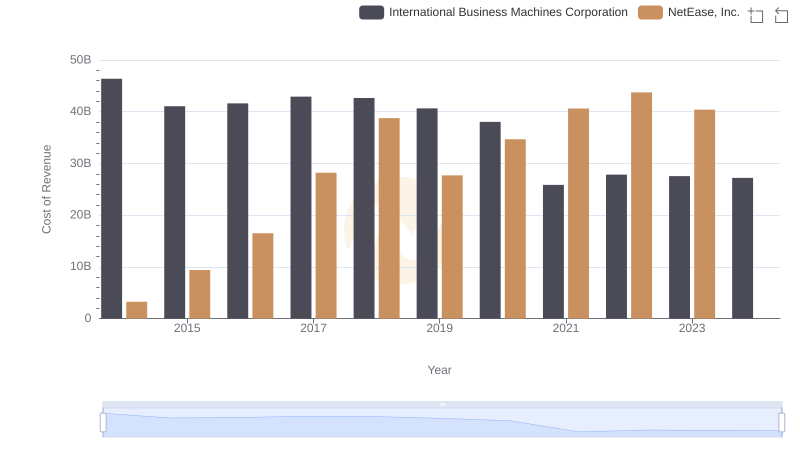
Cost of Revenue: Key Insights for International Business Machines Corporation and NetEase, Inc.
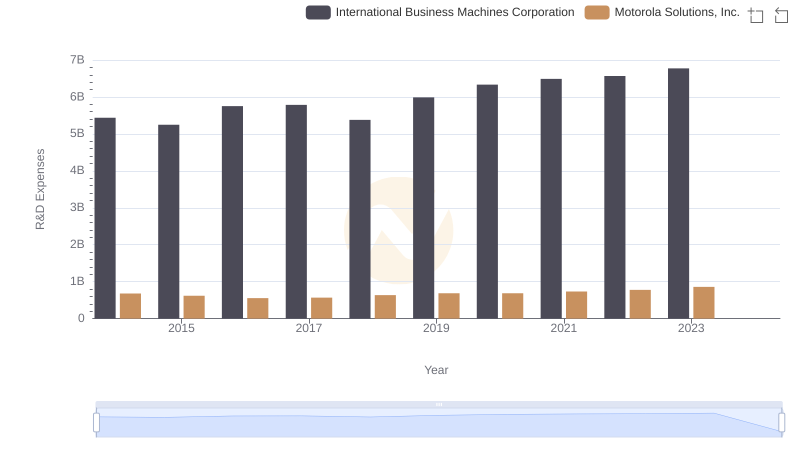
Comparing Innovation Spending: International Business Machines Corporation and Motorola Solutions, Inc.
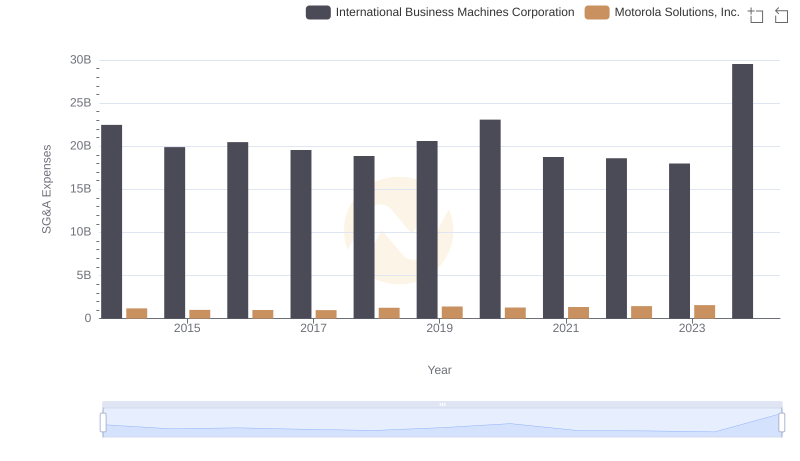
Cost Management Insights: SG&A Expenses for International Business Machines Corporation and Motorola Solutions, Inc.