| __timestamp | Fortinet, Inc. | International Business Machines Corporation |
|---|---|---|
| Wednesday, January 1, 2014 | 231009000 | 46386000000 |
| Thursday, January 1, 2015 | 286777000 | 41057000000 |
| Friday, January 1, 2016 | 337837000 | 41403000000 |
| Sunday, January 1, 2017 | 385284000 | 42196000000 |
| Monday, January 1, 2018 | 450400000 | 42655000000 |
| Tuesday, January 1, 2019 | 505900000 | 26181000000 |
| Wednesday, January 1, 2020 | 570000000 | 24314000000 |
| Friday, January 1, 2021 | 783000000 | 25865000000 |
| Saturday, January 1, 2022 | 1084900000 | 27842000000 |
| Sunday, January 1, 2023 | 1237200000 | 27560000000 |
| Monday, January 1, 2024 | 1157600000 | 27202000000 |
Infusing magic into the data realm
In the ever-evolving landscape of technology, understanding the cost dynamics of industry giants like International Business Machines Corporation (IBM) and Fortinet, Inc. is crucial. Over the past decade, IBM's cost of revenue has seen a significant decline, dropping from approximately 46 billion in 2014 to around 27 billion in 2023. This represents a reduction of nearly 41%, highlighting IBM's strategic shift towards more efficient operations.
Conversely, Fortinet has experienced a remarkable increase in its cost of revenue, surging from about 231 million in 2014 to over 1.2 billion in 2023. This fivefold increase underscores Fortinet's aggressive expansion and investment in its cybersecurity offerings. Notably, the data for 2024 is incomplete, indicating a potential area for further analysis.
These trends offer a fascinating glimpse into the contrasting strategies of these two tech titans, reflecting broader shifts in the industry.
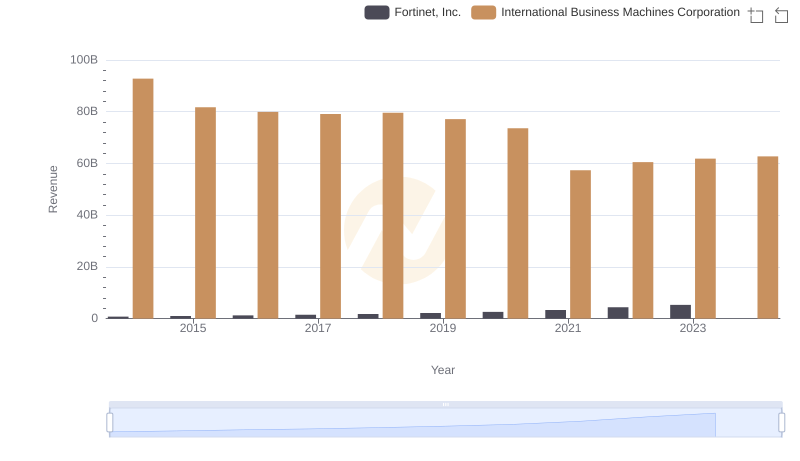
Revenue Insights: International Business Machines Corporation and Fortinet, Inc. Performance Compared
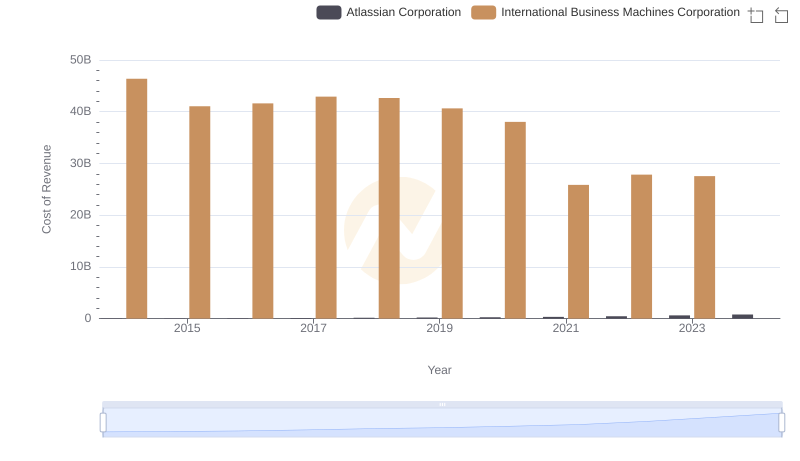
Cost of Revenue: Key Insights for International Business Machines Corporation and Atlassian Corporation
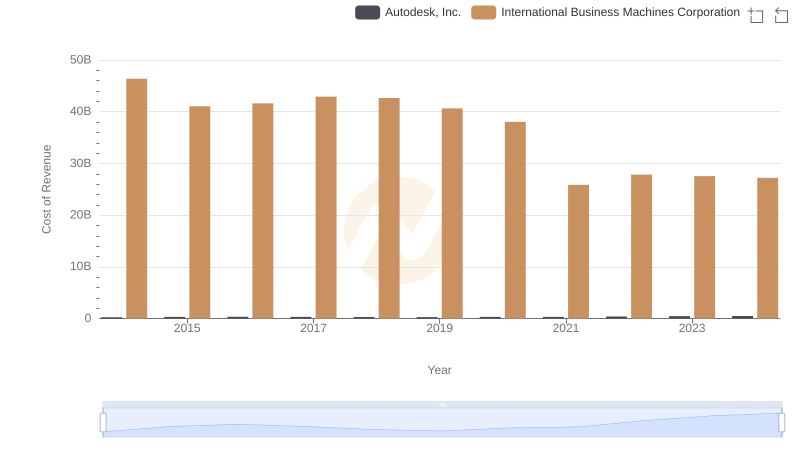
Cost of Revenue Trends: International Business Machines Corporation vs Autodesk, Inc.
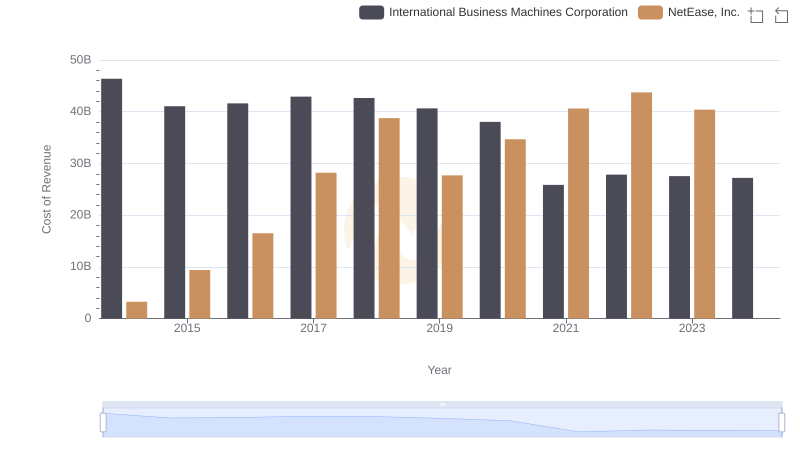
Cost of Revenue: Key Insights for International Business Machines Corporation and NetEase, Inc.
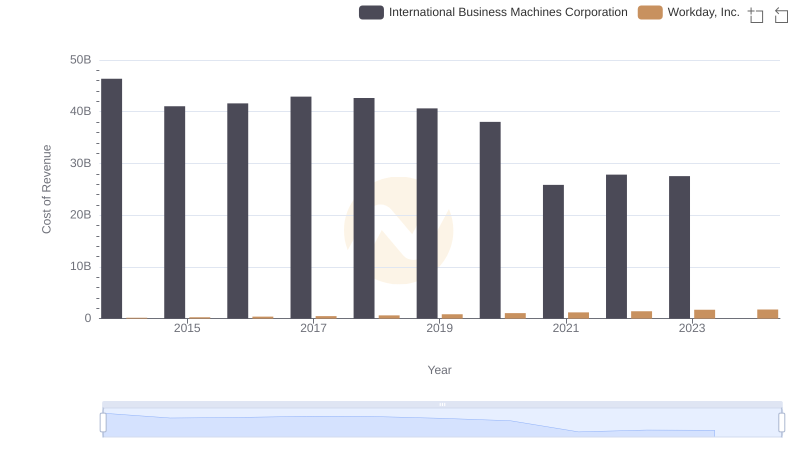
Cost of Revenue Comparison: International Business Machines Corporation vs Workday, Inc.
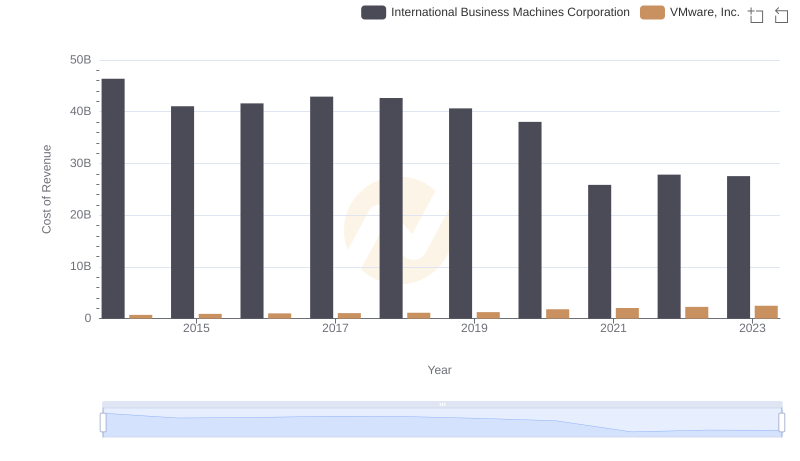
Cost of Revenue Trends: International Business Machines Corporation vs VMware, Inc.
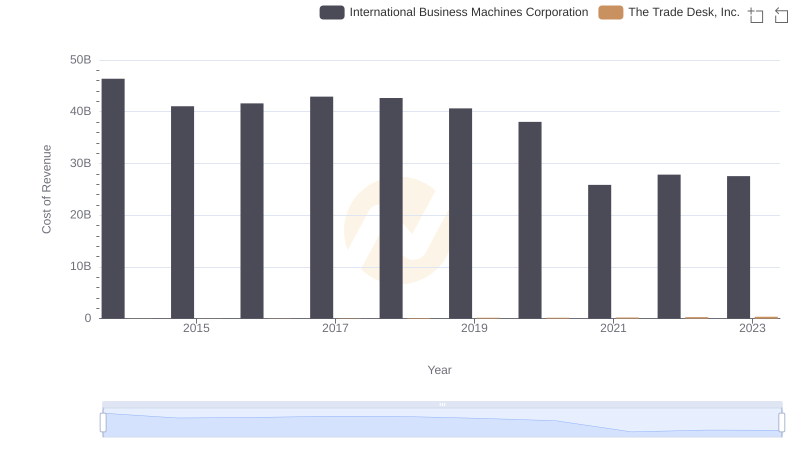
Cost Insights: Breaking Down International Business Machines Corporation and The Trade Desk, Inc.'s Expenses
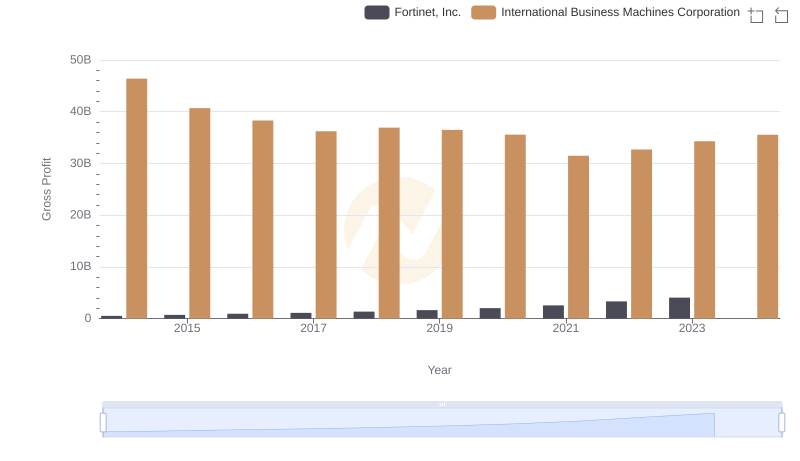
Who Generates Higher Gross Profit? International Business Machines Corporation or Fortinet, Inc.
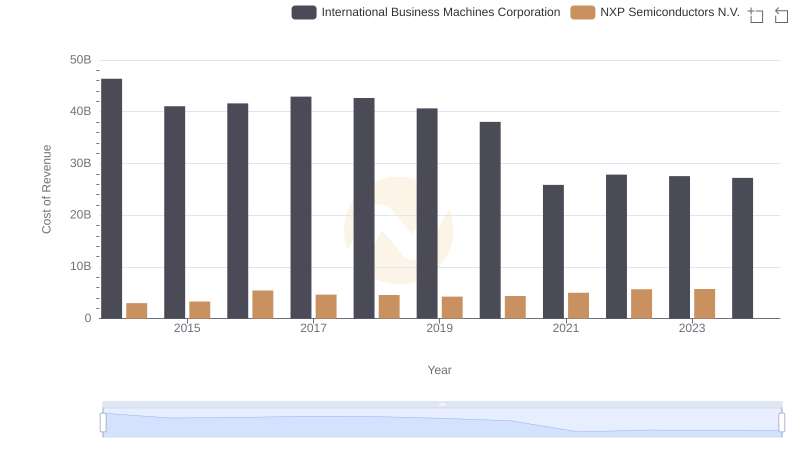
Cost of Revenue Comparison: International Business Machines Corporation vs NXP Semiconductors N.V.
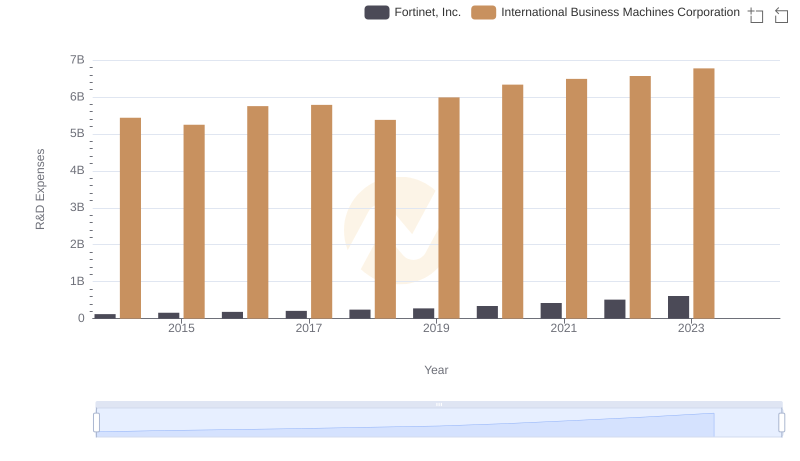
Research and Development: Comparing Key Metrics for International Business Machines Corporation and Fortinet, Inc.
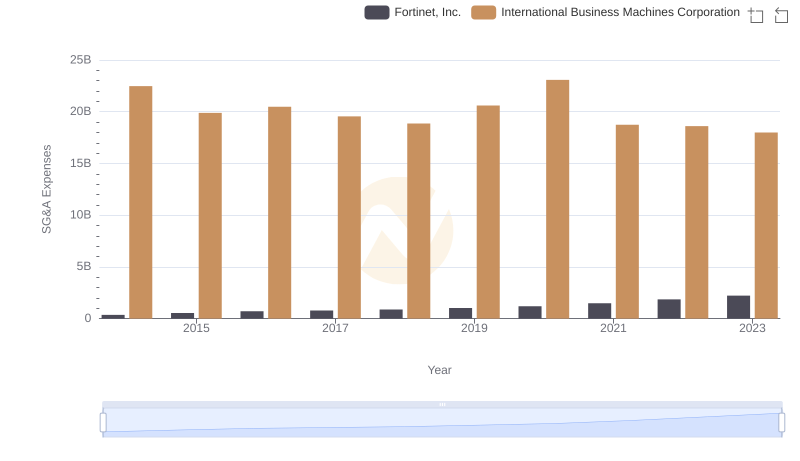
Cost Management Insights: SG&A Expenses for International Business Machines Corporation and Fortinet, Inc.
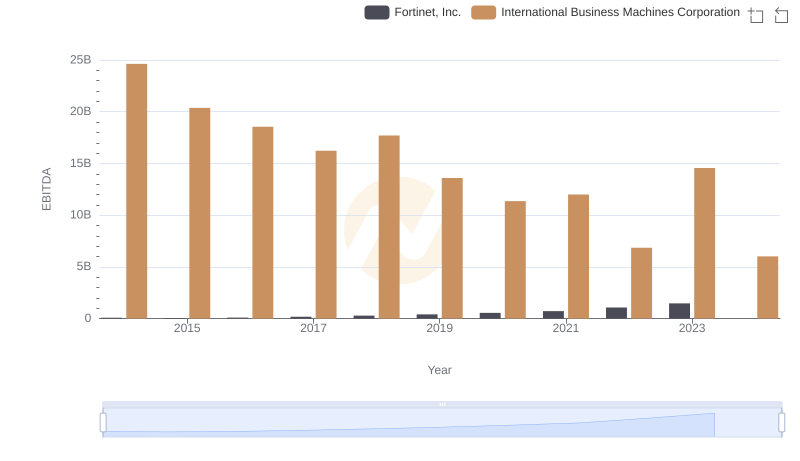
A Side-by-Side Analysis of EBITDA: International Business Machines Corporation and Fortinet, Inc.