| __timestamp | International Business Machines Corporation | Telefonaktiebolaget LM Ericsson (publ) |
|---|---|---|
| Wednesday, January 1, 2014 | 46386000000 | 145556000000 |
| Thursday, January 1, 2015 | 41057000000 | 161101000000 |
| Friday, January 1, 2016 | 41403000000 | 156243000000 |
| Sunday, January 1, 2017 | 42196000000 | 156758000000 |
| Monday, January 1, 2018 | 42655000000 | 142638000000 |
| Tuesday, January 1, 2019 | 26181000000 | 142392000000 |
| Wednesday, January 1, 2020 | 24314000000 | 138666000000 |
| Friday, January 1, 2021 | 25865000000 | 131565000000 |
| Saturday, January 1, 2022 | 27842000000 | 158251000000 |
| Sunday, January 1, 2023 | 27560000000 | 161749000000 |
| Monday, January 1, 2024 | 27202000000 |
Unleashing the power of data
In the ever-evolving tech industry, understanding cost dynamics is crucial. From 2014 to 2023, International Business Machines Corporation (IBM) and Telefonaktiebolaget LM Ericsson (publ) have shown distinct trends in their cost of revenue. IBM's cost of revenue has seen a significant decline, dropping by approximately 41% from 2014 to 2023. This reduction reflects IBM's strategic shift towards more efficient operations and possibly a focus on higher-margin services. In contrast, Ericsson's cost of revenue has remained relatively stable, with a slight increase of about 11% over the same period, indicating consistent operational costs in its telecommunications infrastructure business. Notably, data for Ericsson in 2024 is missing, suggesting potential changes or reporting delays. These trends highlight the contrasting strategies of two tech giants in managing their operational costs over a decade.
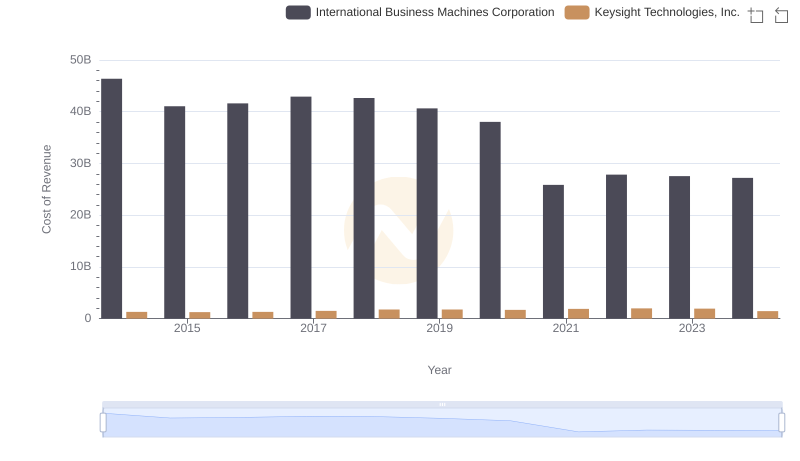
Cost of Revenue Trends: International Business Machines Corporation vs Keysight Technologies, Inc.
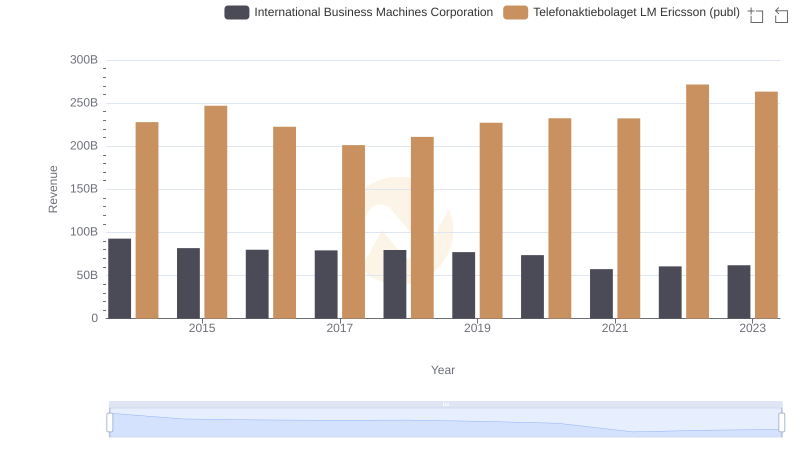
Comparing Revenue Performance: International Business Machines Corporation or Telefonaktiebolaget LM Ericsson (publ)?
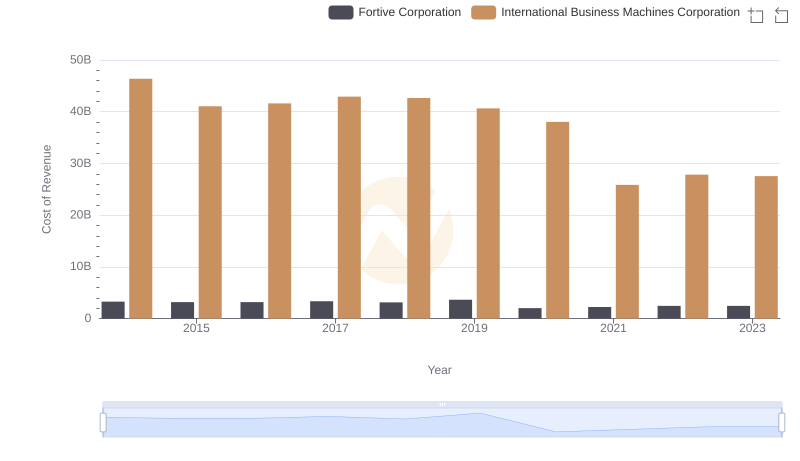
Cost of Revenue Comparison: International Business Machines Corporation vs Fortive Corporation

Analyzing Cost of Revenue: International Business Machines Corporation and Broadridge Financial Solutions, Inc.
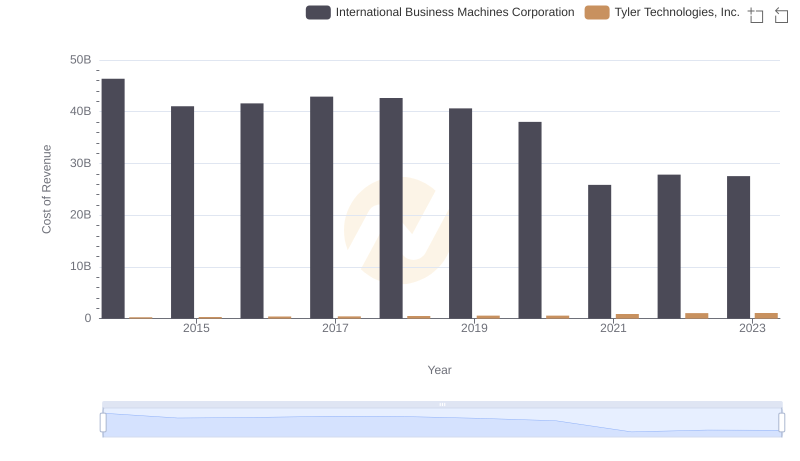
Cost of Revenue: Key Insights for International Business Machines Corporation and Tyler Technologies, Inc.
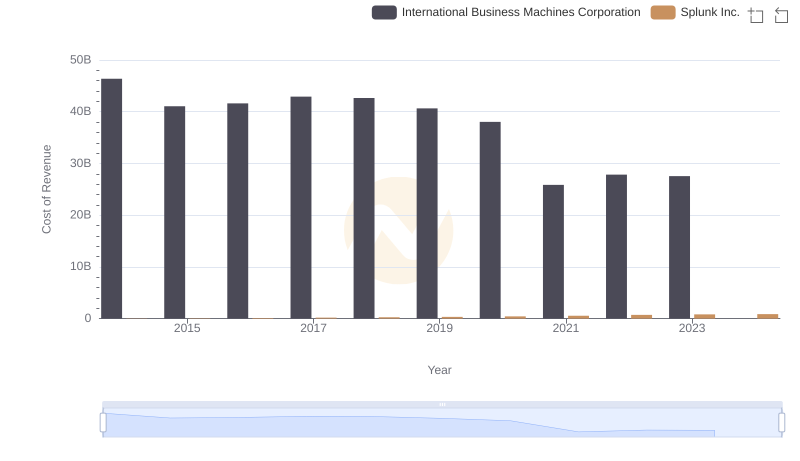
Cost of Revenue Comparison: International Business Machines Corporation vs Splunk Inc.
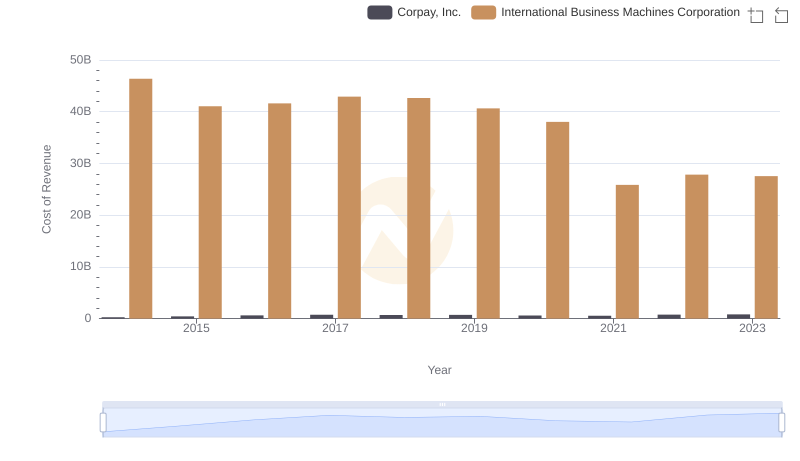
Analyzing Cost of Revenue: International Business Machines Corporation and Corpay, Inc.
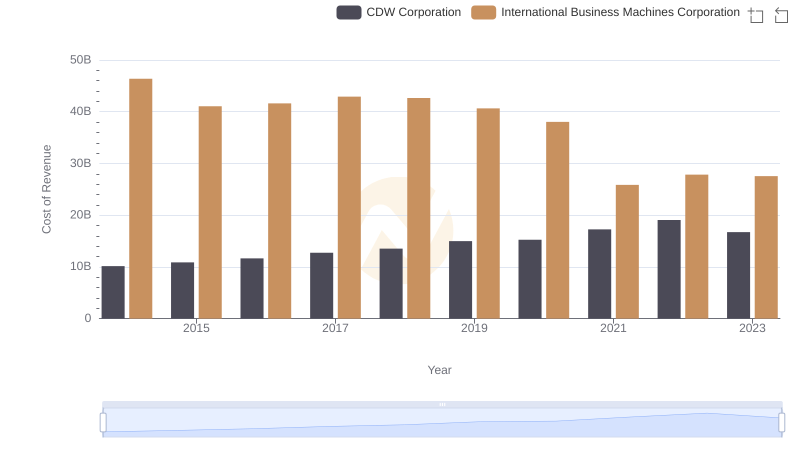
Analyzing Cost of Revenue: International Business Machines Corporation and CDW Corporation
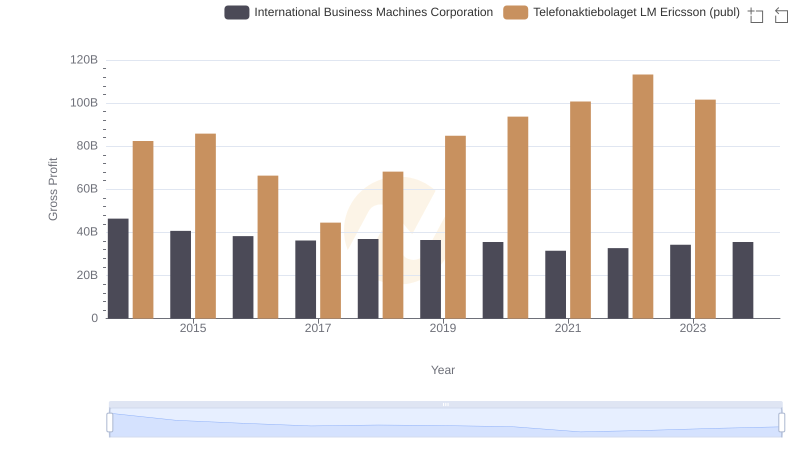
Key Insights on Gross Profit: International Business Machines Corporation vs Telefonaktiebolaget LM Ericsson (publ)
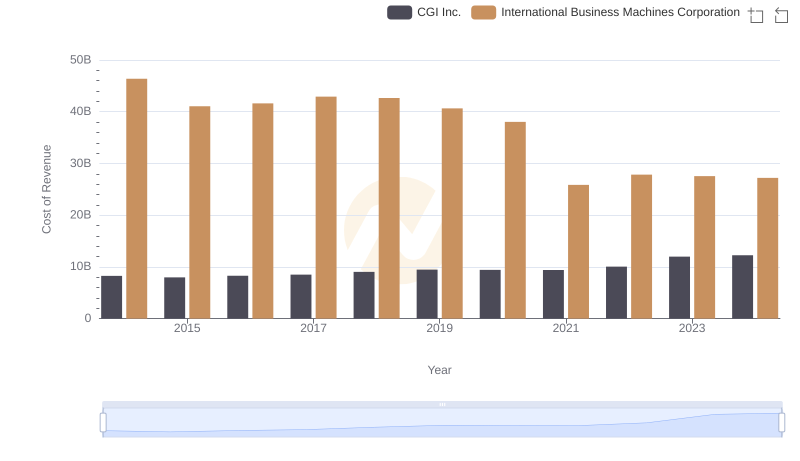
Cost of Revenue Comparison: International Business Machines Corporation vs CGI Inc.
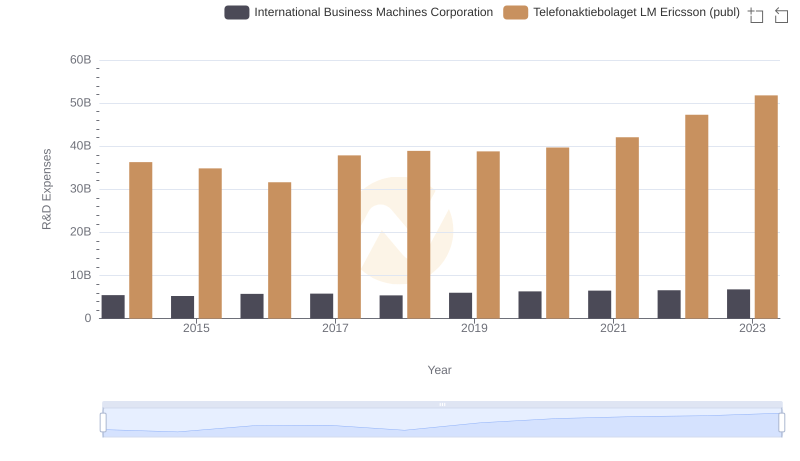
Analyzing R&D Budgets: International Business Machines Corporation vs Telefonaktiebolaget LM Ericsson (publ)
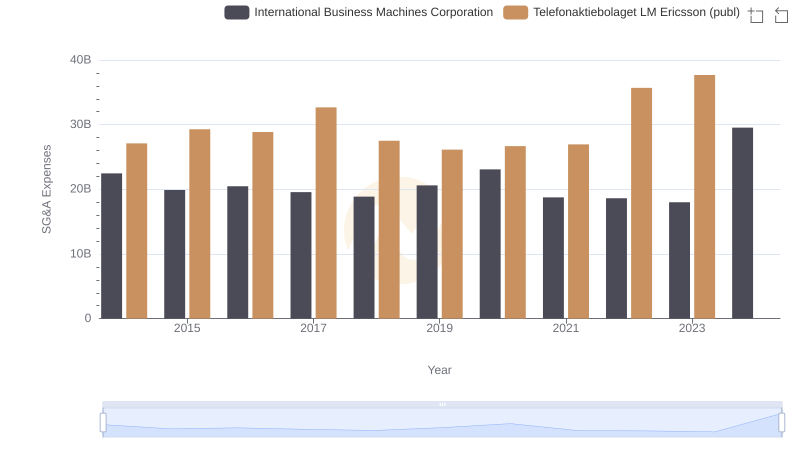
International Business Machines Corporation vs Telefonaktiebolaget LM Ericsson (publ): SG&A Expense Trends