| __timestamp | International Business Machines Corporation | Nokia Oyj |
|---|---|---|
| Wednesday, January 1, 2014 | 46386000000 | 7094000000 |
| Thursday, January 1, 2015 | 41057000000 | 7045000000 |
| Friday, January 1, 2016 | 41403000000 | 15157000000 |
| Sunday, January 1, 2017 | 42196000000 | 14009000000 |
| Monday, January 1, 2018 | 42655000000 | 14117000000 |
| Tuesday, January 1, 2019 | 26181000000 | 14989000000 |
| Wednesday, January 1, 2020 | 24314000000 | 13653000000 |
| Friday, January 1, 2021 | 25865000000 | 13368000000 |
| Saturday, January 1, 2022 | 27842000000 | 14689000000 |
| Sunday, January 1, 2023 | 27560000000 | 13571000000 |
| Monday, January 1, 2024 | 27202000000 |
Igniting the spark of knowledge
In the ever-evolving landscape of technology, understanding cost structures is pivotal. Over the past decade, International Business Machines Corporation (IBM) and Nokia Oyj have showcased intriguing trends in their cost of revenue. IBM, a stalwart in the tech industry, saw its cost of revenue peak in 2014, with a gradual decline of approximately 41% by 2023. This trend reflects IBM's strategic shift towards more efficient operations and possibly a focus on high-margin services.
Conversely, Nokia, a leader in telecommunications, experienced a more stable cost structure, with a notable increase of about 92% from 2015 to 2016, aligning with its strategic acquisitions and expansion in network infrastructure. However, Nokia's data for 2024 remains elusive, hinting at potential shifts or strategic pivots.
These insights underscore the dynamic nature of cost management in the tech sector, offering a window into the strategic priorities of these industry giants.
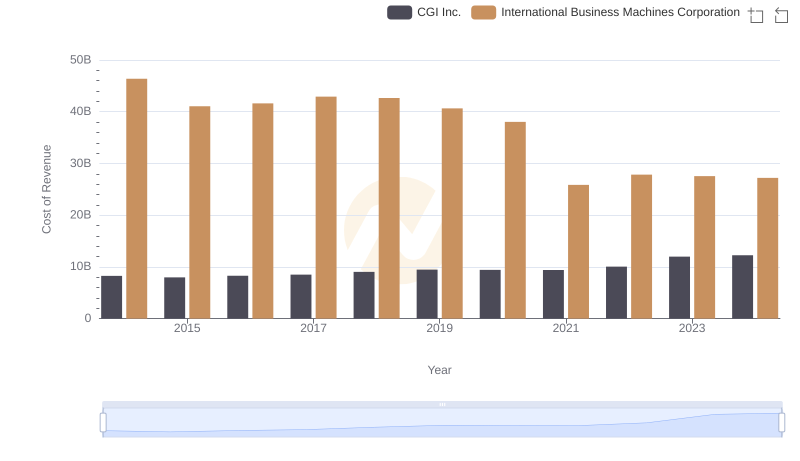
Cost of Revenue Comparison: International Business Machines Corporation vs CGI Inc.
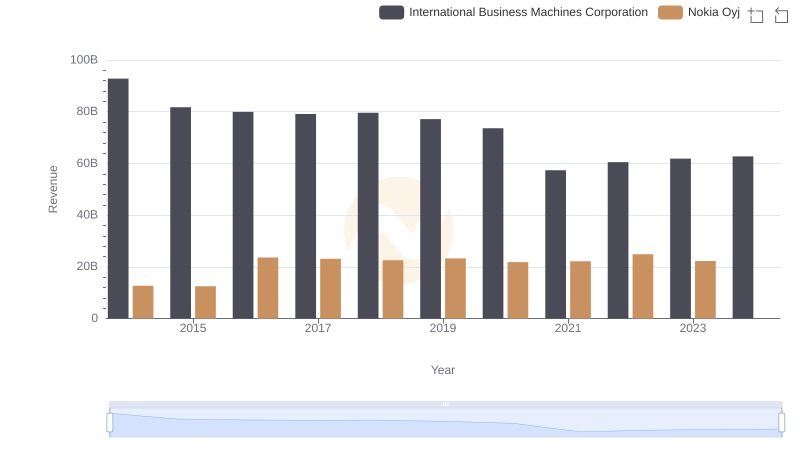
International Business Machines Corporation or Nokia Oyj: Who Leads in Yearly Revenue?
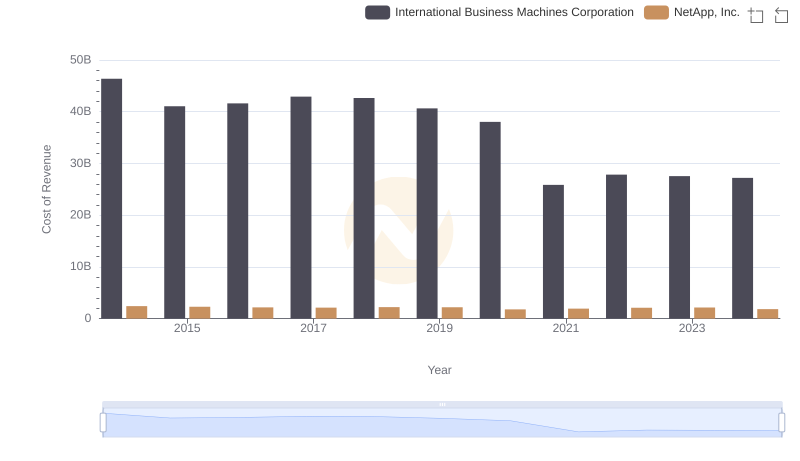
Analyzing Cost of Revenue: International Business Machines Corporation and NetApp, Inc.
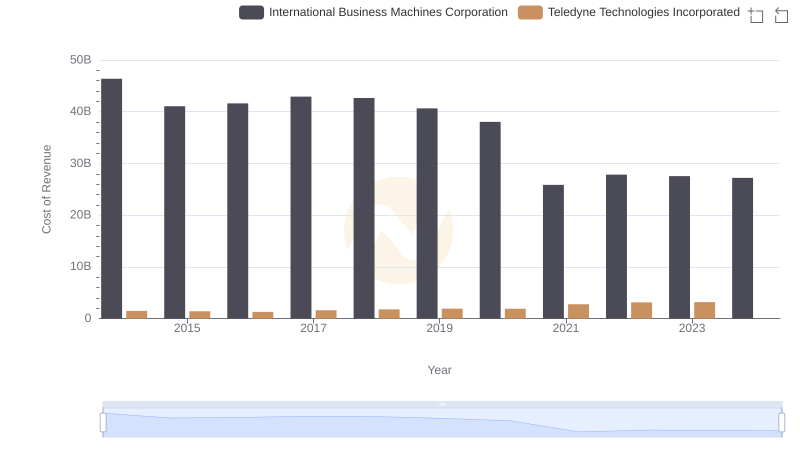
Cost Insights: Breaking Down International Business Machines Corporation and Teledyne Technologies Incorporated's Expenses
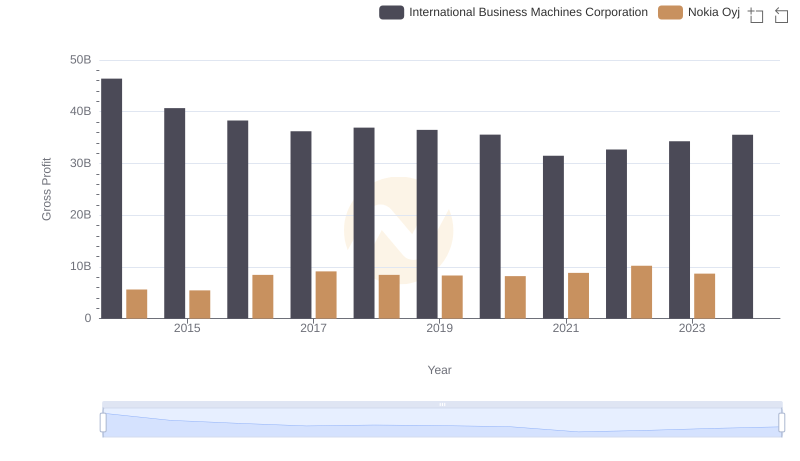
Gross Profit Comparison: International Business Machines Corporation and Nokia Oyj Trends

Comparing Cost of Revenue Efficiency: International Business Machines Corporation vs Ubiquiti Inc.
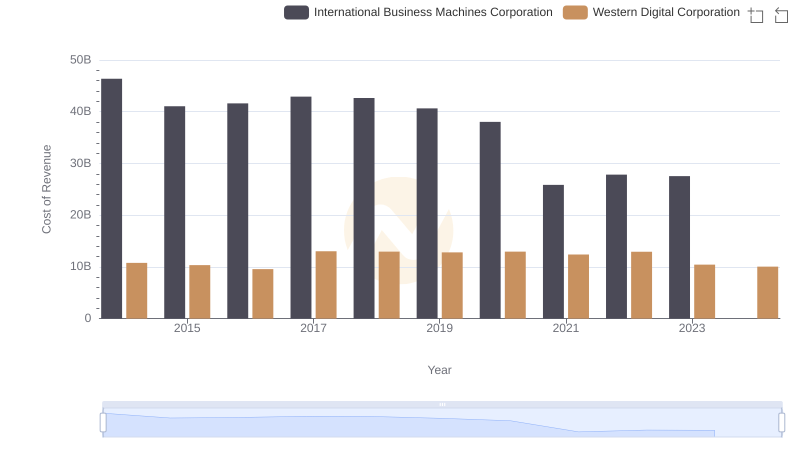
Cost of Revenue: Key Insights for International Business Machines Corporation and Western Digital Corporation
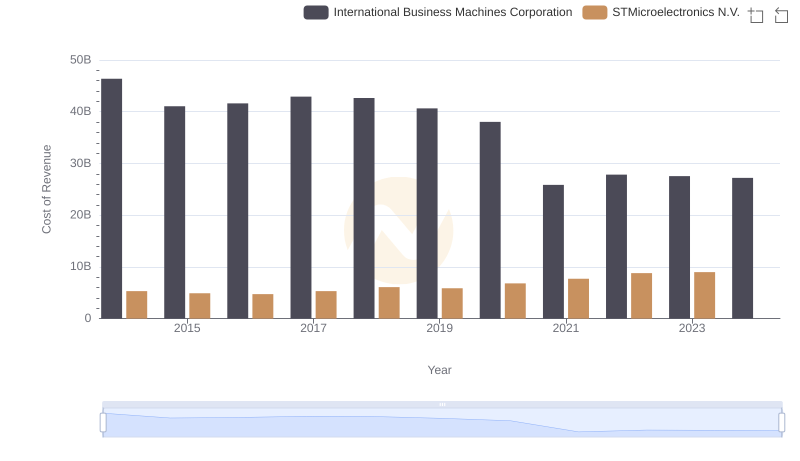
Cost of Revenue Comparison: International Business Machines Corporation vs STMicroelectronics N.V.
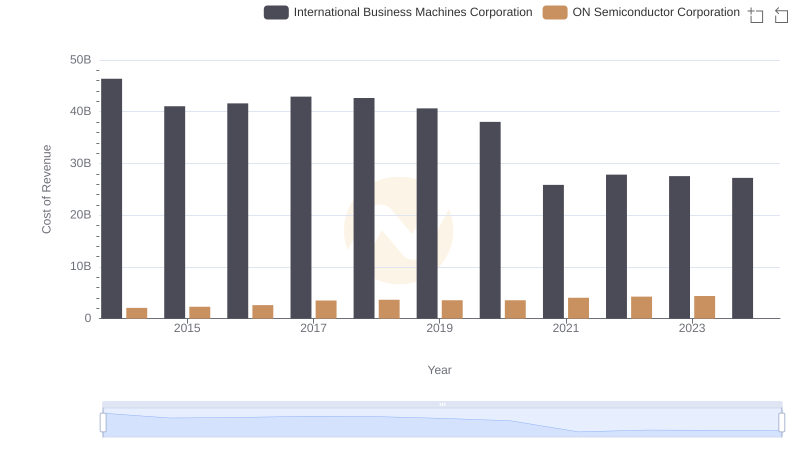
Cost Insights: Breaking Down International Business Machines Corporation and ON Semiconductor Corporation's Expenses
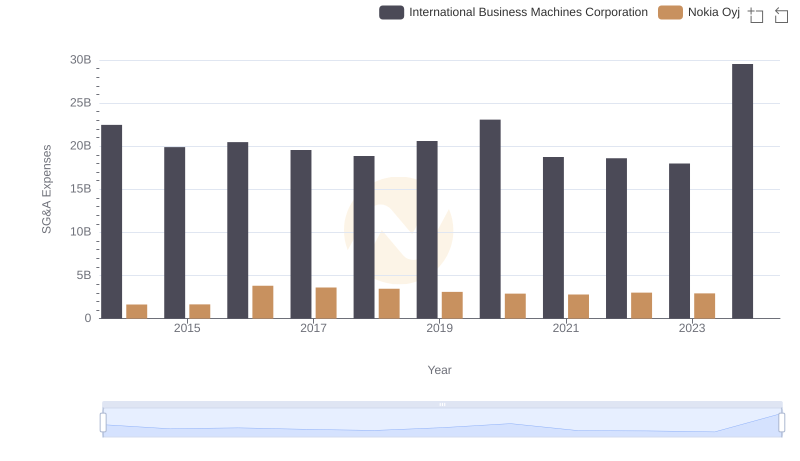
SG&A Efficiency Analysis: Comparing International Business Machines Corporation and Nokia Oyj
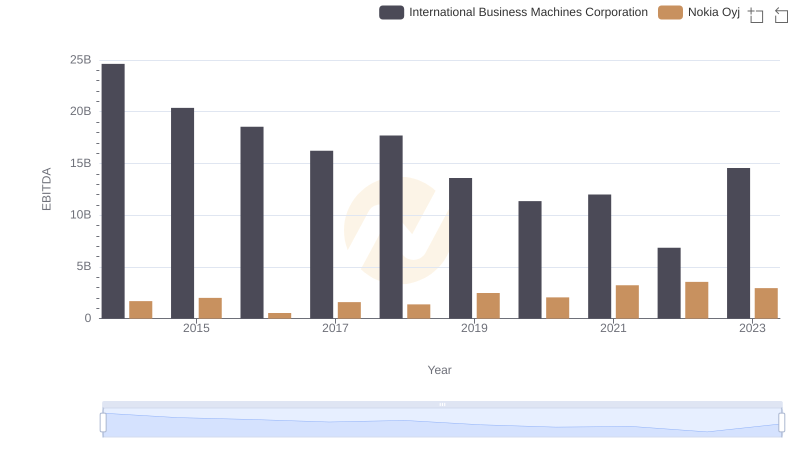
Professional EBITDA Benchmarking: International Business Machines Corporation vs Nokia Oyj