| __timestamp | International Business Machines Corporation | NetApp, Inc. |
|---|---|---|
| Wednesday, January 1, 2014 | 46386000000 | 2406000000 |
| Thursday, January 1, 2015 | 41057000000 | 2289500000 |
| Friday, January 1, 2016 | 41403000000 | 2173000000 |
| Sunday, January 1, 2017 | 42196000000 | 2129000000 |
| Monday, January 1, 2018 | 42655000000 | 2212000000 |
| Tuesday, January 1, 2019 | 26181000000 | 2201000000 |
| Wednesday, January 1, 2020 | 24314000000 | 1789000000 |
| Friday, January 1, 2021 | 25865000000 | 1929000000 |
| Saturday, January 1, 2022 | 27842000000 | 2098000000 |
| Sunday, January 1, 2023 | 27560000000 | 2153000000 |
| Monday, January 1, 2024 | 27202000000 | 1835000000 |
Igniting the spark of knowledge
In the ever-evolving landscape of technology, understanding the cost dynamics of industry giants like International Business Machines Corporation (IBM) and NetApp, Inc. is crucial. From 2014 to 2024, IBM's cost of revenue has seen a significant decline of approximately 41%, from $46.4 billion to $27.2 billion. This trend reflects IBM's strategic shift towards more efficient operations and possibly a focus on higher-margin services.
Conversely, NetApp's cost of revenue has remained relatively stable, with a slight decrease of around 24% over the same period, from $2.4 billion to $1.8 billion. This stability suggests a consistent operational model, potentially driven by its focus on data management solutions.
These trends highlight the contrasting strategies of these tech titans in managing their operational costs, offering valuable insights into their financial health and strategic priorities.
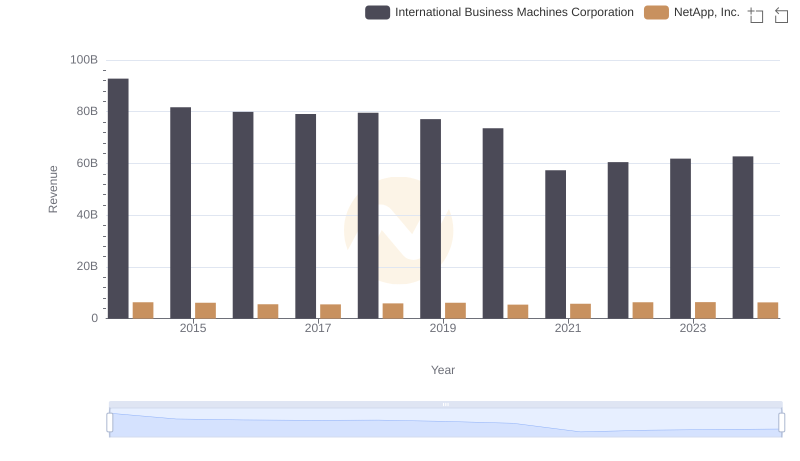
Comparing Revenue Performance: International Business Machines Corporation or NetApp, Inc.?
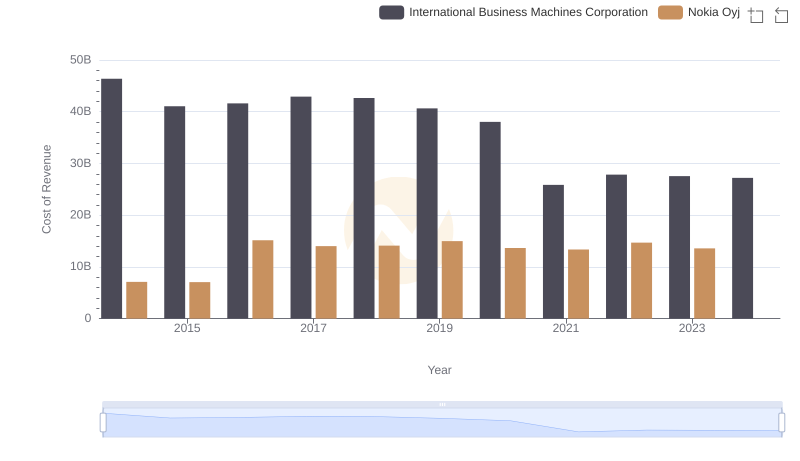
Analyzing Cost of Revenue: International Business Machines Corporation and Nokia Oyj
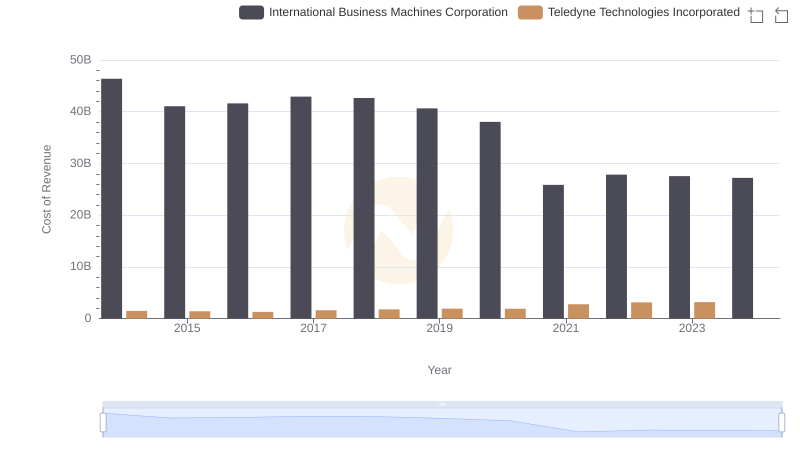
Cost Insights: Breaking Down International Business Machines Corporation and Teledyne Technologies Incorporated's Expenses
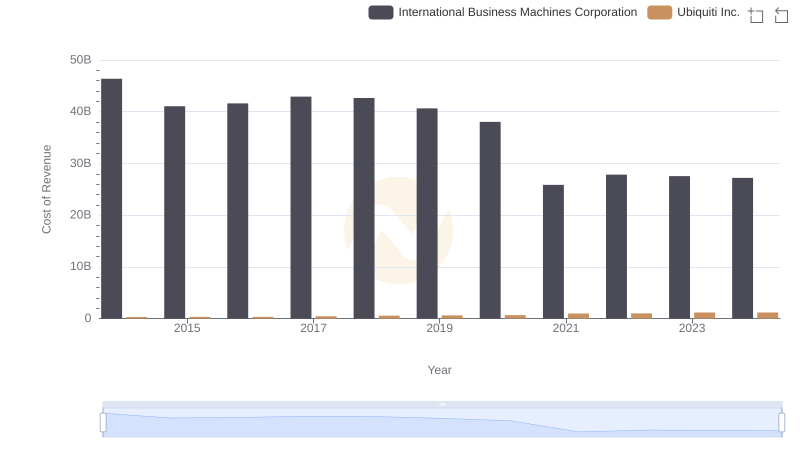
Comparing Cost of Revenue Efficiency: International Business Machines Corporation vs Ubiquiti Inc.
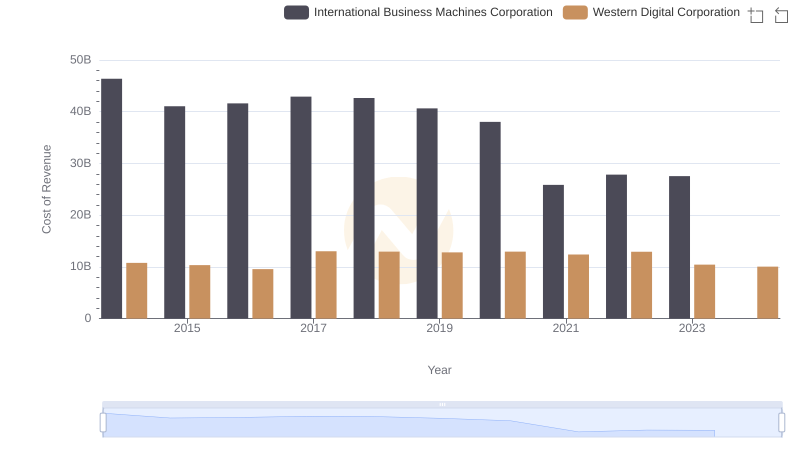
Cost of Revenue: Key Insights for International Business Machines Corporation and Western Digital Corporation
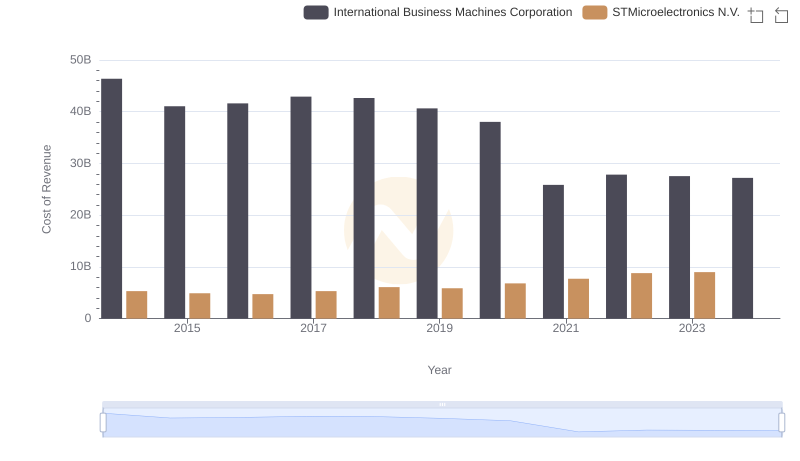
Cost of Revenue Comparison: International Business Machines Corporation vs STMicroelectronics N.V.
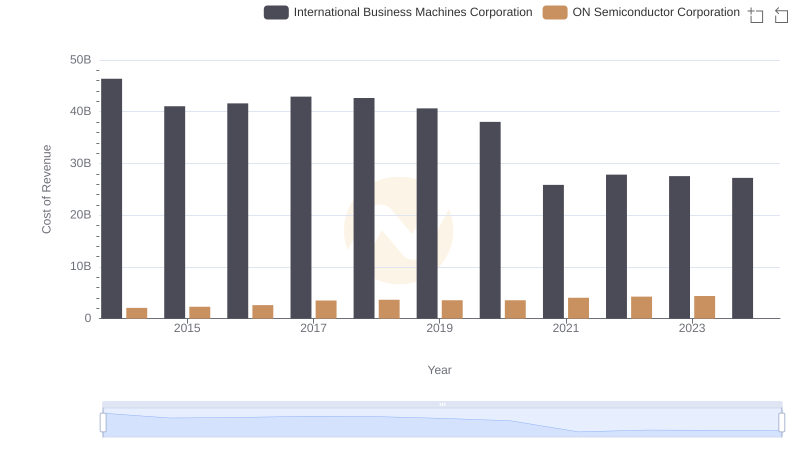
Cost Insights: Breaking Down International Business Machines Corporation and ON Semiconductor Corporation's Expenses

International Business Machines Corporation vs Seagate Technology Holdings plc: Efficiency in Cost of Revenue Explored

Gross Profit Trends Compared: International Business Machines Corporation vs NetApp, Inc.
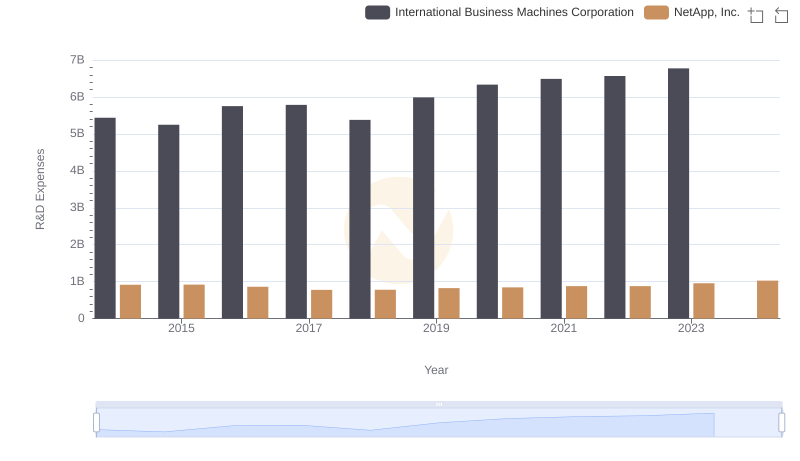
R&D Spending Showdown: International Business Machines Corporation vs NetApp, Inc.
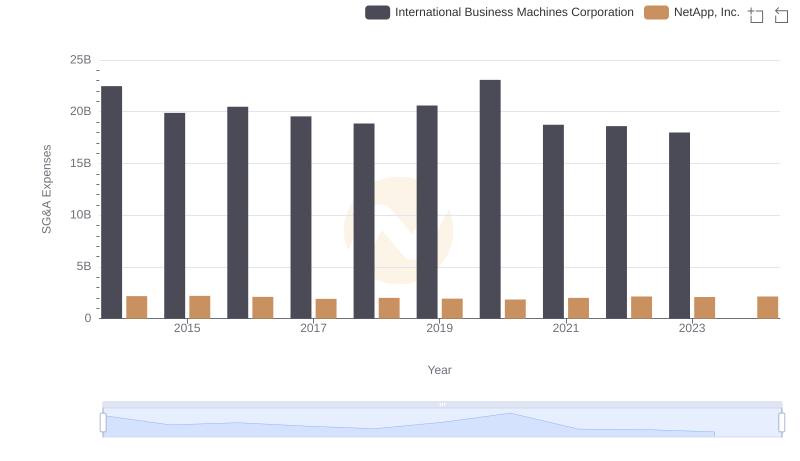
Who Optimizes SG&A Costs Better? International Business Machines Corporation or NetApp, Inc.
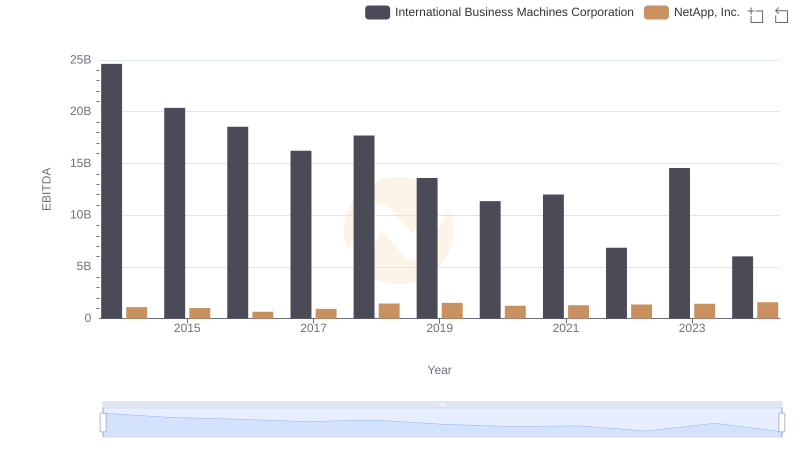
EBITDA Performance Review: International Business Machines Corporation vs NetApp, Inc.