| __timestamp | Ingersoll Rand Inc. | Rentokil Initial plc |
|---|---|---|
| Wednesday, January 1, 2014 | 2570005000 | 1740800000 |
| Thursday, January 1, 2015 | 2126900000 | 1759000000 |
| Friday, January 1, 2016 | 1939436000 | 2168100000 |
| Sunday, January 1, 2017 | 2375400000 | 2412300000 |
| Monday, January 1, 2018 | 2689800000 | 2472300000 |
| Tuesday, January 1, 2019 | 2451900000 | 2676200000 |
| Wednesday, January 1, 2020 | 4910200000 | 2789400000 |
| Friday, January 1, 2021 | 5152400000 | 2953900000 |
| Saturday, January 1, 2022 | 5916300000 | 3714000000 |
| Sunday, January 1, 2023 | 6876100000 | 5375000000 |
| Monday, January 1, 2024 | 0 |
In pursuit of knowledge
In the ever-evolving landscape of global business, revenue performance is a key indicator of a company's success. This chart provides a fascinating glimpse into the revenue trajectories of two industry giants: Ingersoll Rand Inc. and Rentokil Initial plc, from 2014 to 2023.
Ingersoll Rand Inc. has demonstrated a robust growth pattern, with its revenue surging by approximately 168% over the decade. Notably, the year 2020 marked a significant leap, with revenues jumping by nearly 100% compared to the previous year. Meanwhile, Rentokil Initial plc has also shown commendable growth, with a 209% increase in revenue by 2023, reflecting its strategic expansions and market adaptability.
This comparative analysis not only highlights the resilience and strategic prowess of these companies but also offers valuable insights into their market positioning and future potential.
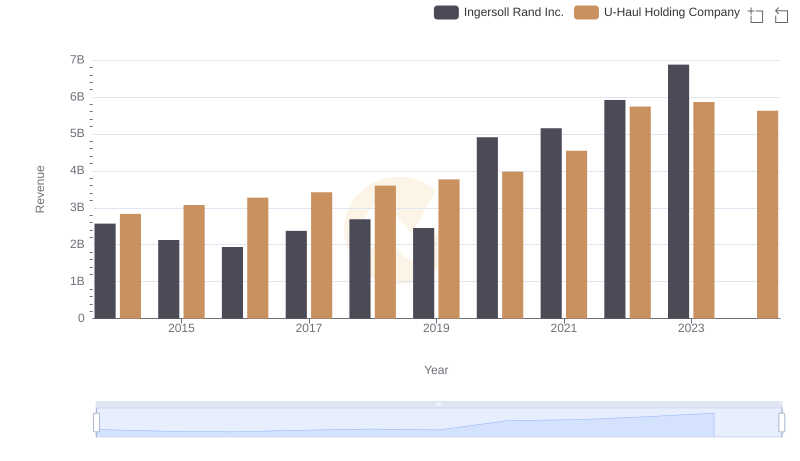
Revenue Showdown: Ingersoll Rand Inc. vs U-Haul Holding Company
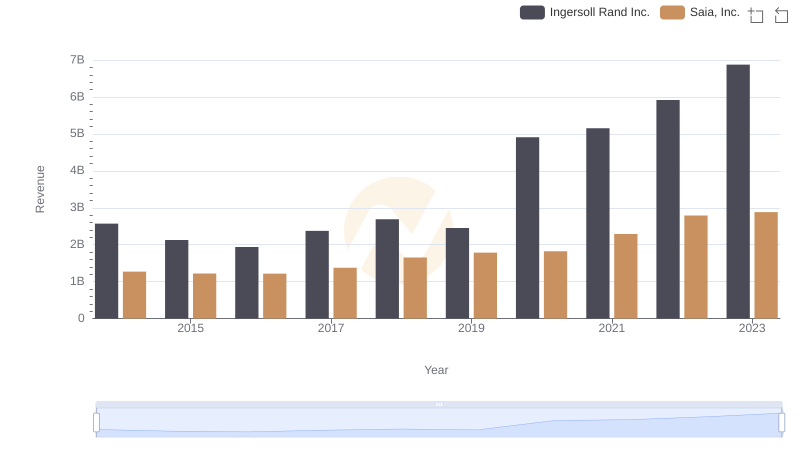
Ingersoll Rand Inc. and Saia, Inc.: A Comprehensive Revenue Analysis
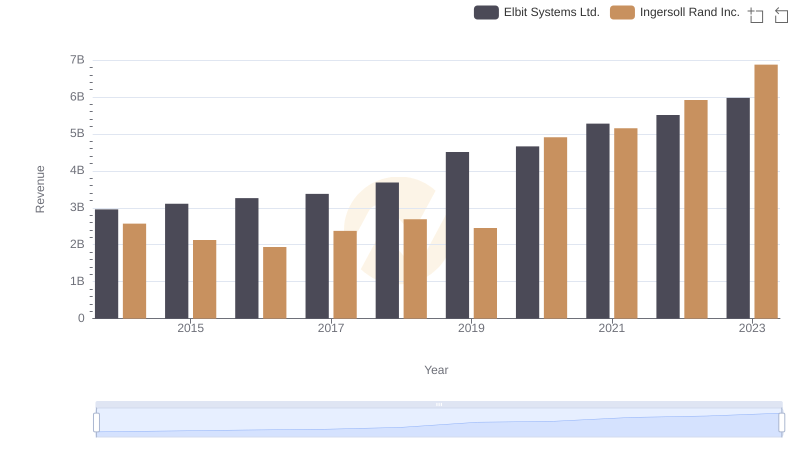
Comparing Revenue Performance: Ingersoll Rand Inc. or Elbit Systems Ltd.?
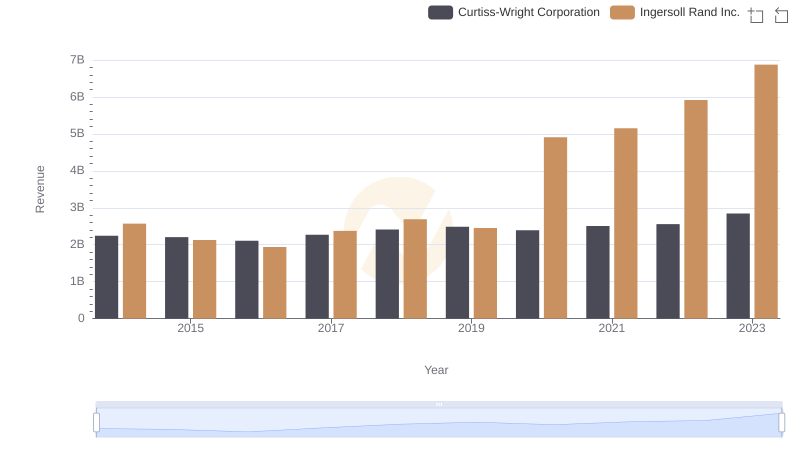
Ingersoll Rand Inc. or Curtiss-Wright Corporation: Who Leads in Yearly Revenue?
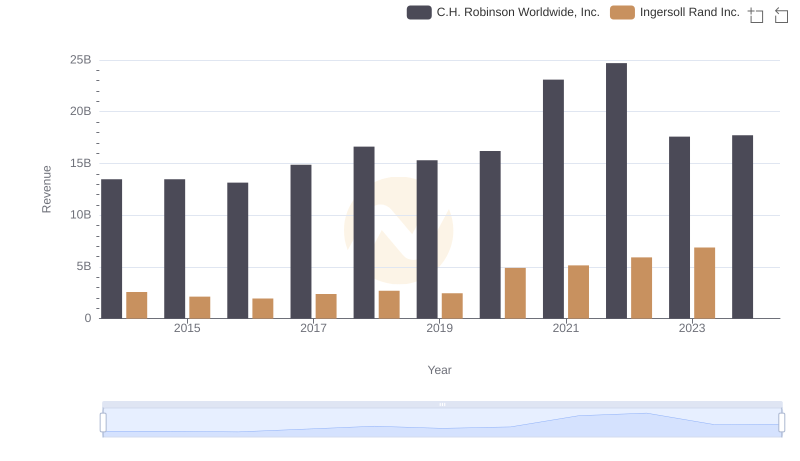
Comparing Revenue Performance: Ingersoll Rand Inc. or C.H. Robinson Worldwide, Inc.?
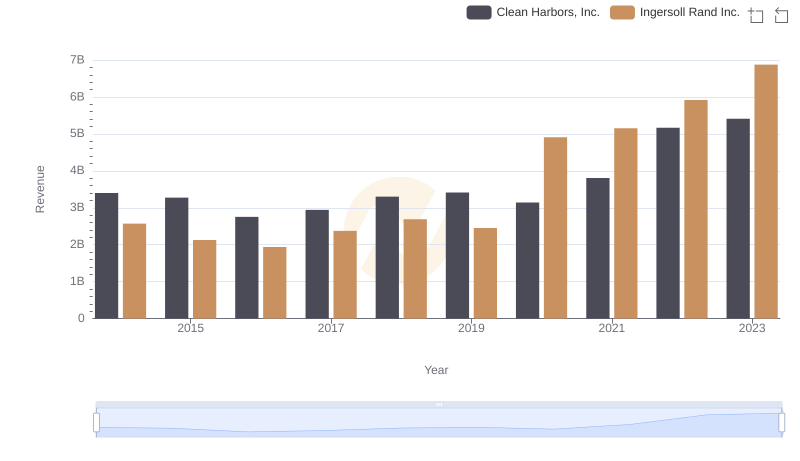
Comparing Revenue Performance: Ingersoll Rand Inc. or Clean Harbors, Inc.?
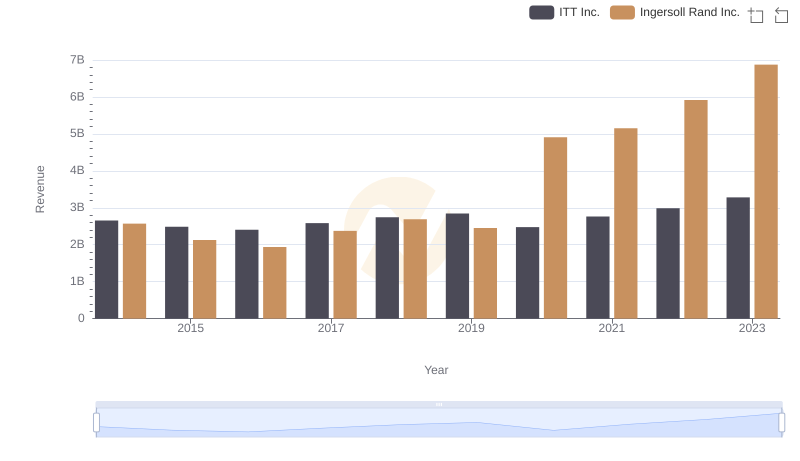
Ingersoll Rand Inc. or ITT Inc.: Who Leads in Yearly Revenue?
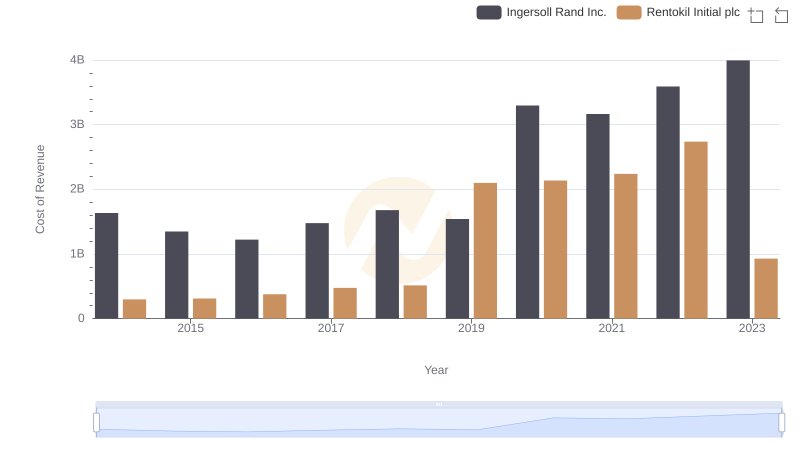
Cost of Revenue Comparison: Ingersoll Rand Inc. vs Rentokil Initial plc

Who Generates More Revenue? Ingersoll Rand Inc. or TFI International Inc.
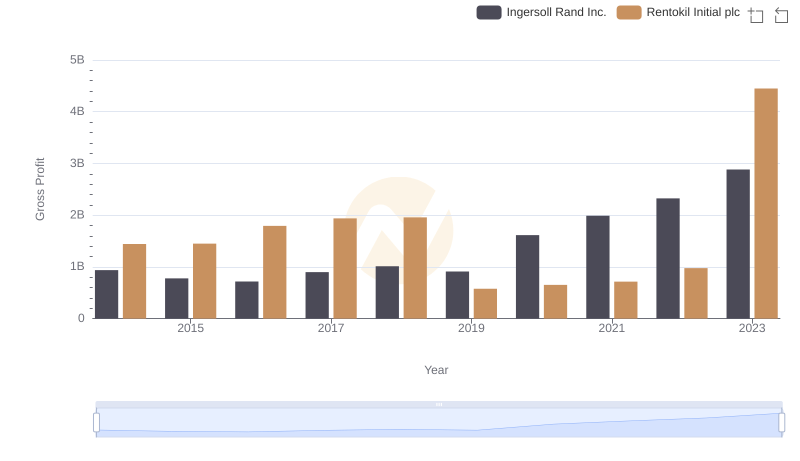
Gross Profit Comparison: Ingersoll Rand Inc. and Rentokil Initial plc Trends
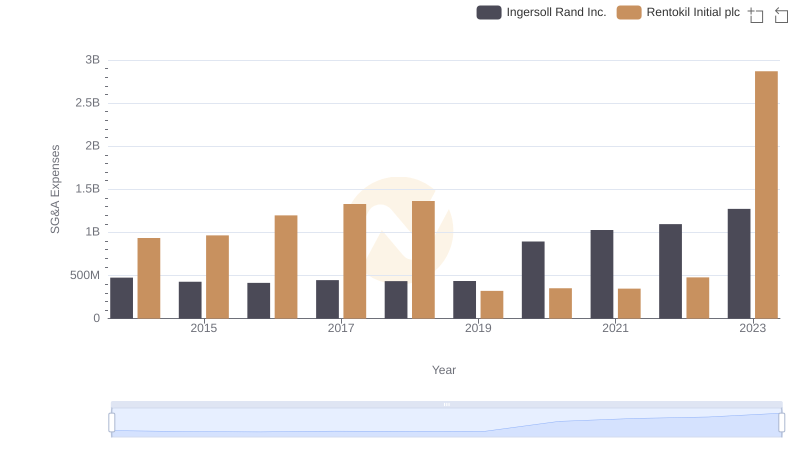
Ingersoll Rand Inc. and Rentokil Initial plc: SG&A Spending Patterns Compared