| __timestamp | Ingersoll Rand Inc. | TFI International Inc. |
|---|---|---|
| Wednesday, January 1, 2014 | 1633224000 | 2782605137 |
| Thursday, January 1, 2015 | 1347800000 | 2551474032 |
| Friday, January 1, 2016 | 1222705000 | 2636493564 |
| Sunday, January 1, 2017 | 1477500000 | 3364979721 |
| Monday, January 1, 2018 | 1677300000 | 3251443800 |
| Tuesday, January 1, 2019 | 1540200000 | 3461987950 |
| Wednesday, January 1, 2020 | 3296800000 | 3239249000 |
| Friday, January 1, 2021 | 3163900000 | 6182566000 |
| Saturday, January 1, 2022 | 3590700000 | 7385640000 |
| Sunday, January 1, 2023 | 3993900000 | 6255775000 |
| Monday, January 1, 2024 | 0 |
Cracking the code
In the ever-evolving landscape of industrial and transportation sectors, understanding cost dynamics is crucial. From 2014 to 2023, Ingersoll Rand Inc. and TFI International Inc. have shown distinct trajectories in their cost of revenue. Ingersoll Rand Inc. experienced a steady increase, with costs rising by approximately 145% over the decade, peaking in 2023. This growth reflects strategic investments and scaling operations. Meanwhile, TFI International Inc. saw a more dramatic surge, with costs increasing by around 125% from 2014 to 2022, before a slight dip in 2023. This fluctuation highlights the company's aggressive expansion and subsequent cost optimization efforts. These insights not only reveal the companies' financial strategies but also provide a window into broader industry trends. As businesses navigate economic challenges, understanding these cost patterns is vital for stakeholders and investors alike.
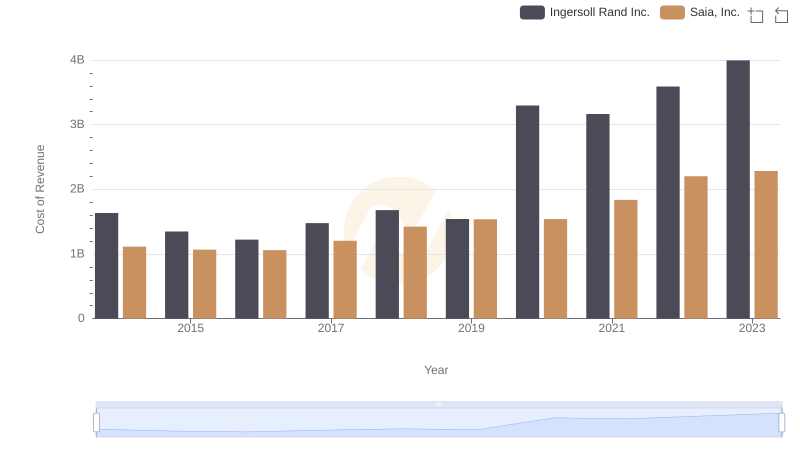
Cost of Revenue: Key Insights for Ingersoll Rand Inc. and Saia, Inc.
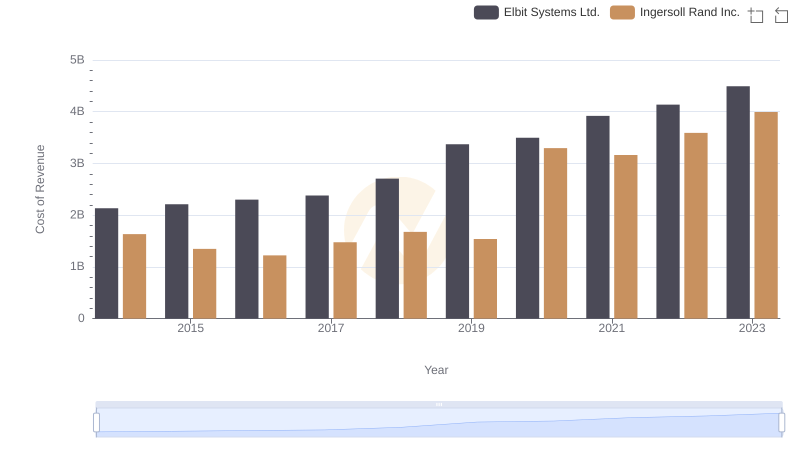
Cost of Revenue Trends: Ingersoll Rand Inc. vs Elbit Systems Ltd.
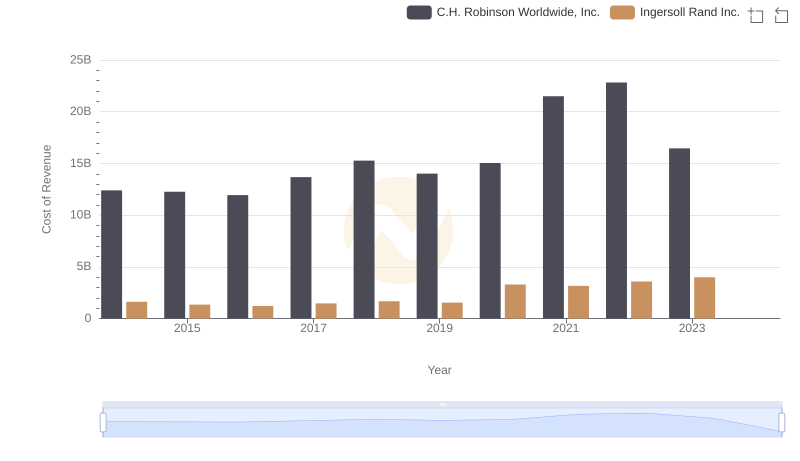
Cost Insights: Breaking Down Ingersoll Rand Inc. and C.H. Robinson Worldwide, Inc.'s Expenses
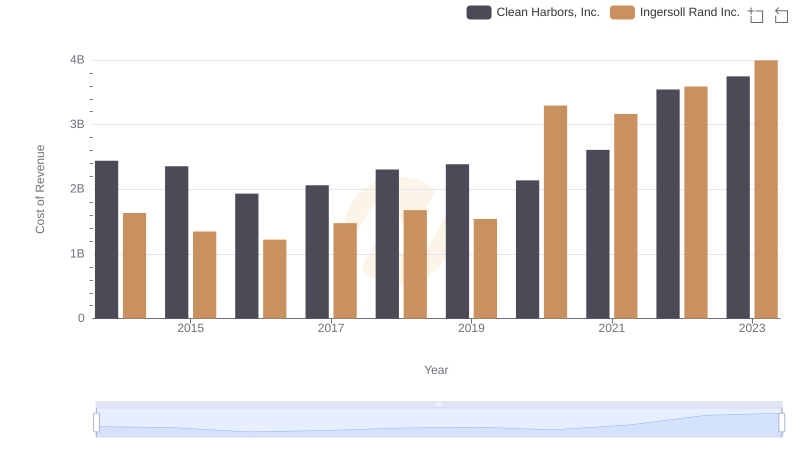
Cost of Revenue: Key Insights for Ingersoll Rand Inc. and Clean Harbors, Inc.
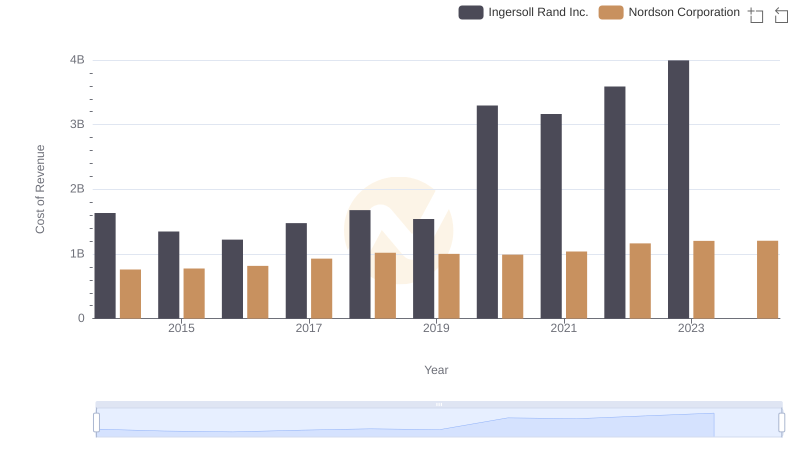
Cost of Revenue Comparison: Ingersoll Rand Inc. vs Nordson Corporation
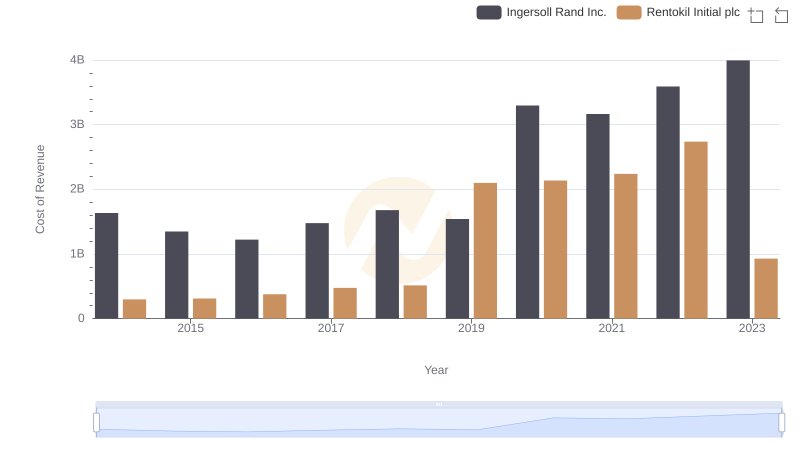
Cost of Revenue Comparison: Ingersoll Rand Inc. vs Rentokil Initial plc

Who Generates More Revenue? Ingersoll Rand Inc. or TFI International Inc.
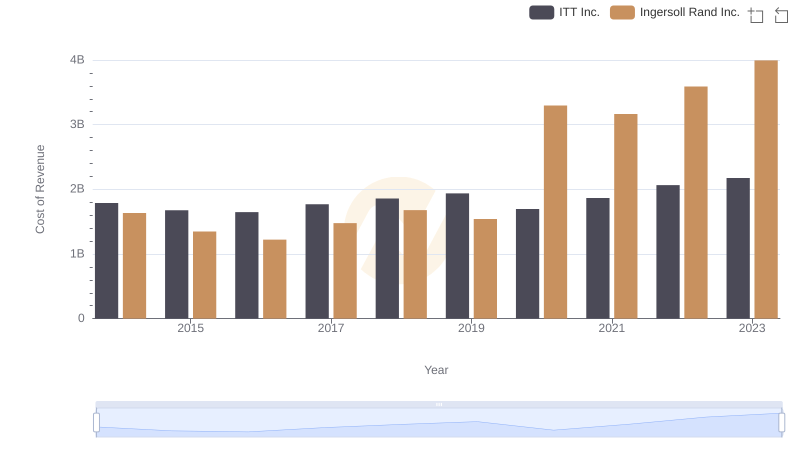
Ingersoll Rand Inc. vs ITT Inc.: Efficiency in Cost of Revenue Explored