| __timestamp | Ingersoll Rand Inc. | Rentokil Initial plc |
|---|---|---|
| Wednesday, January 1, 2014 | 936781000 | 1443300000 |
| Thursday, January 1, 2015 | 779100000 | 1448800000 |
| Friday, January 1, 2016 | 716731000 | 1792000000 |
| Sunday, January 1, 2017 | 897900000 | 1937400000 |
| Monday, January 1, 2018 | 1012500000 | 1958100000 |
| Tuesday, January 1, 2019 | 911700000 | 577200000 |
| Wednesday, January 1, 2020 | 1613400000 | 653000000 |
| Friday, January 1, 2021 | 1988500000 | 714800000 |
| Saturday, January 1, 2022 | 2325600000 | 977000000 |
| Sunday, January 1, 2023 | 2882200000 | 4448000000 |
| Monday, January 1, 2024 | 0 |
Unleashing insights
In the ever-evolving landscape of industrial and service sectors, understanding financial performance is crucial. This analysis delves into the gross profit trends of two industry giants: Ingersoll Rand Inc. and Rentokil Initial plc, from 2014 to 2023. Over this period, Ingersoll Rand Inc. demonstrated a remarkable growth trajectory, with its gross profit surging by approximately 207%, from $937 million in 2014 to $2.88 billion in 2023. Meanwhile, Rentokil Initial plc experienced a more volatile journey, with a notable peak in 2023, reaching $4.45 billion, marking a 208% increase from its 2019 low. This comparison highlights the resilience and strategic prowess of these companies in navigating market challenges. As businesses continue to adapt, these insights offer valuable lessons in financial agility and growth potential.
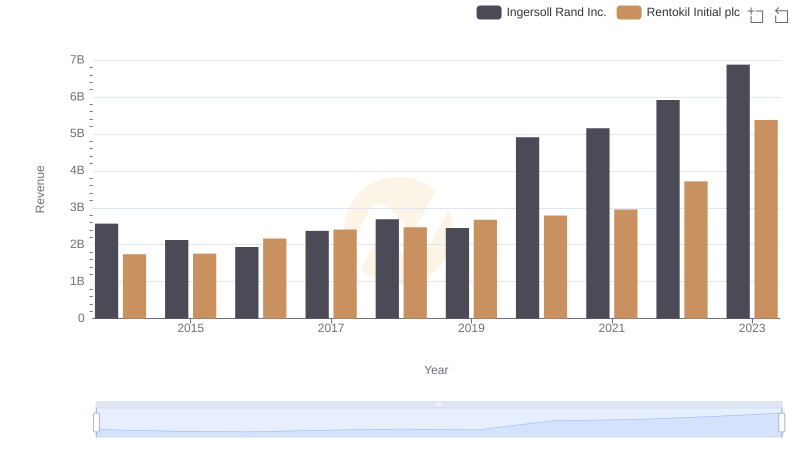
Comparing Revenue Performance: Ingersoll Rand Inc. or Rentokil Initial plc?
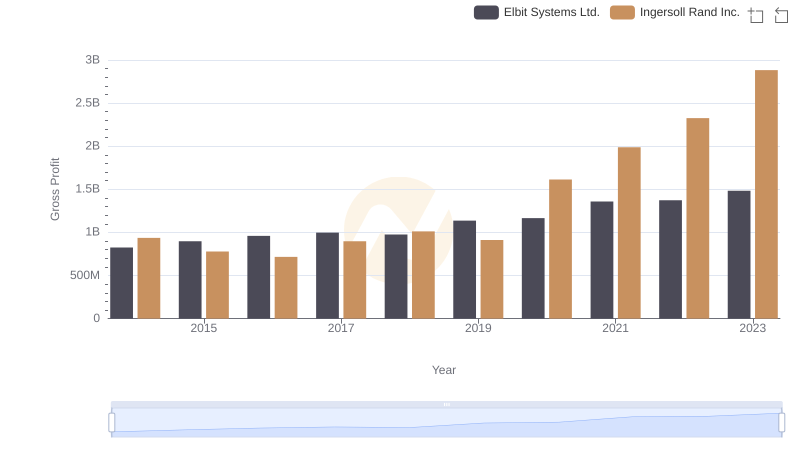
Gross Profit Analysis: Comparing Ingersoll Rand Inc. and Elbit Systems Ltd.
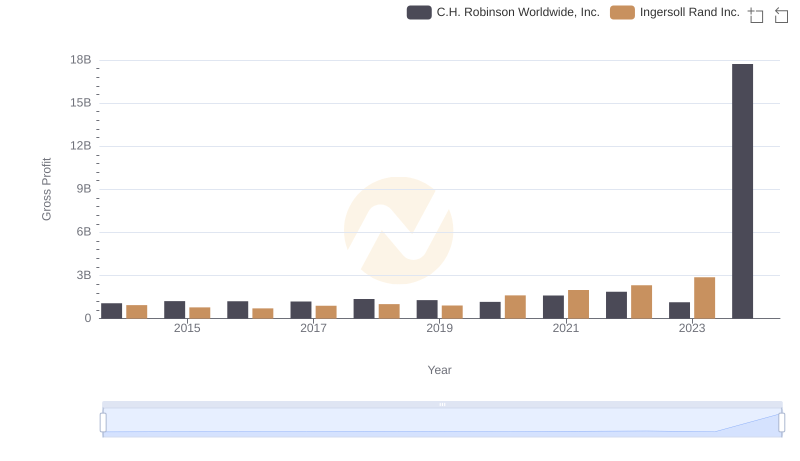
Ingersoll Rand Inc. and C.H. Robinson Worldwide, Inc.: A Detailed Gross Profit Analysis
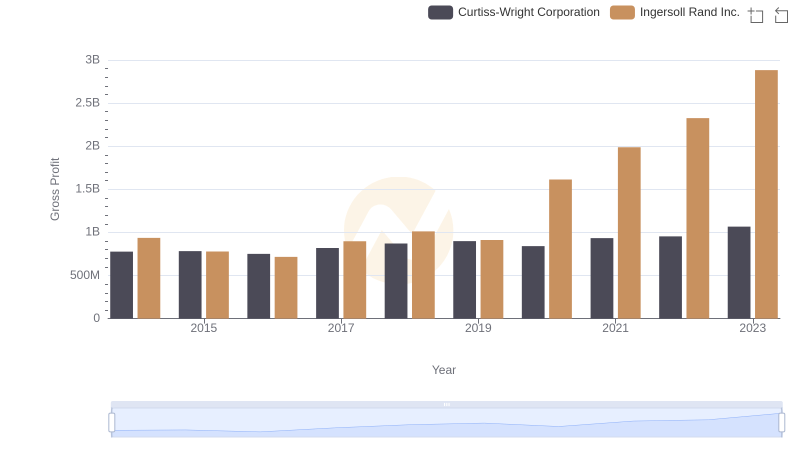
Who Generates Higher Gross Profit? Ingersoll Rand Inc. or Curtiss-Wright Corporation
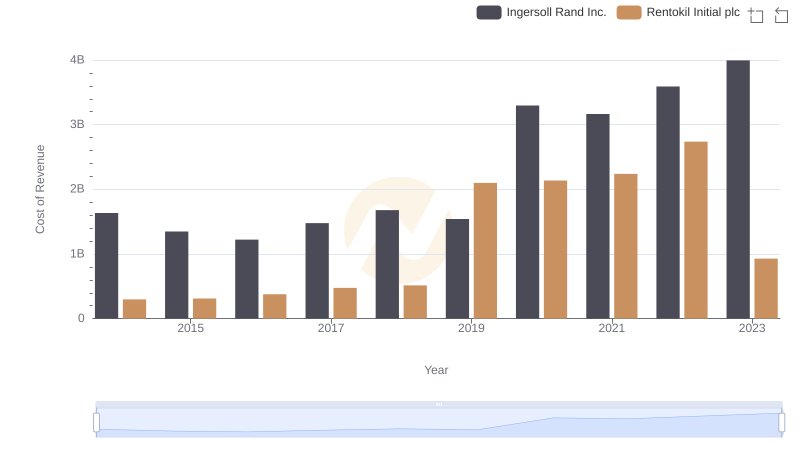
Cost of Revenue Comparison: Ingersoll Rand Inc. vs Rentokil Initial plc
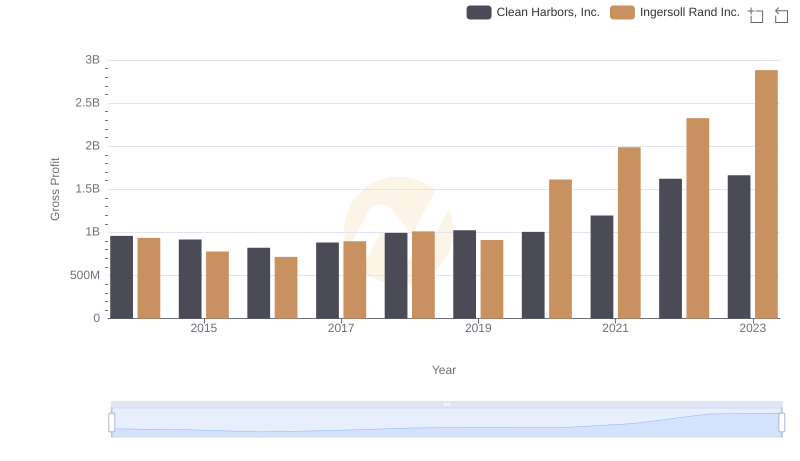
Who Generates Higher Gross Profit? Ingersoll Rand Inc. or Clean Harbors, Inc.
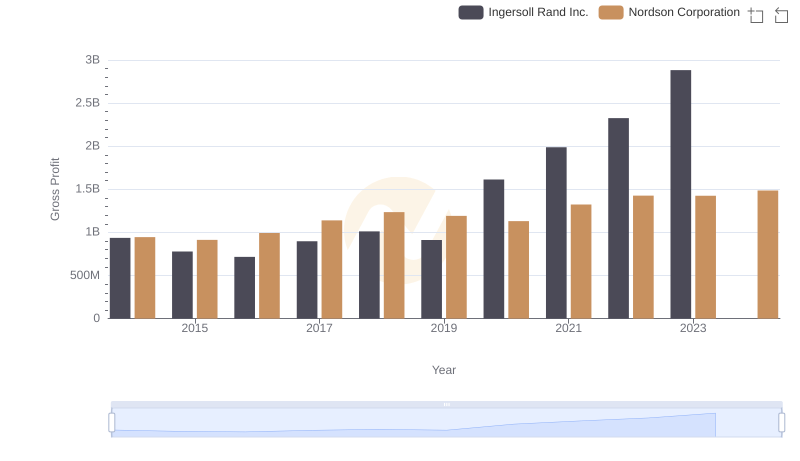
Ingersoll Rand Inc. vs Nordson Corporation: A Gross Profit Performance Breakdown
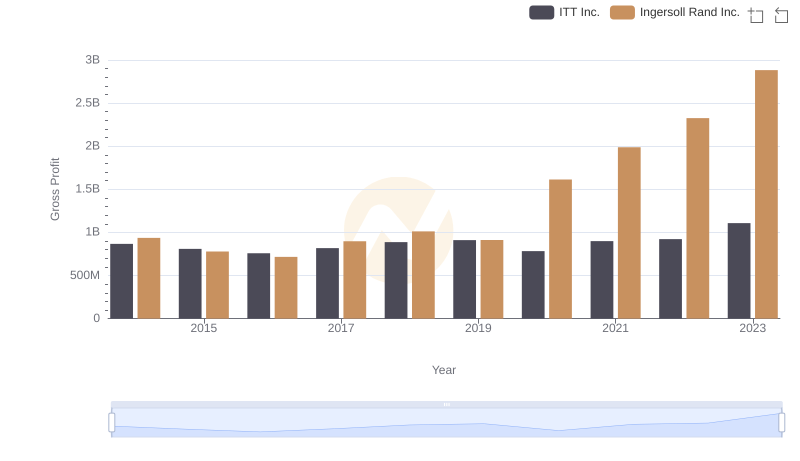
Gross Profit Comparison: Ingersoll Rand Inc. and ITT Inc. Trends
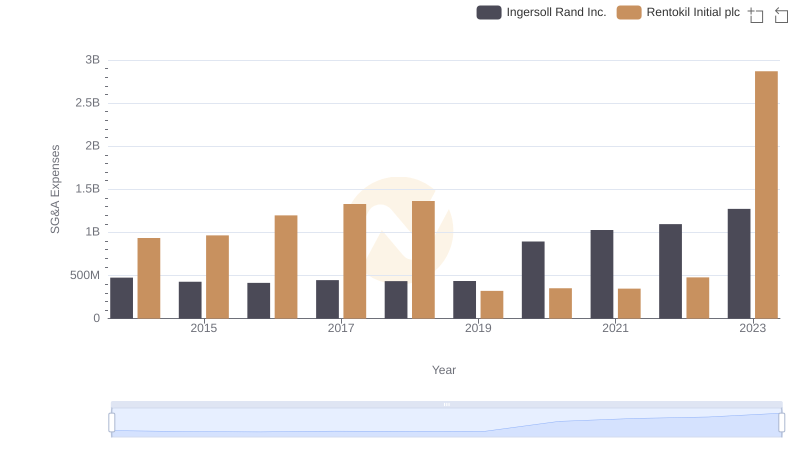
Ingersoll Rand Inc. and Rentokil Initial plc: SG&A Spending Patterns Compared