| __timestamp | Ingersoll Rand Inc. | Rentokil Initial plc |
|---|---|---|
| Wednesday, January 1, 2014 | 476000000 | 935700000 |
| Thursday, January 1, 2015 | 427000000 | 965700000 |
| Friday, January 1, 2016 | 414339000 | 1197600000 |
| Sunday, January 1, 2017 | 446600000 | 1329600000 |
| Monday, January 1, 2018 | 434600000 | 1364000000 |
| Tuesday, January 1, 2019 | 436400000 | 322500000 |
| Wednesday, January 1, 2020 | 894800000 | 352000000 |
| Friday, January 1, 2021 | 1028000000 | 348600000 |
| Saturday, January 1, 2022 | 1095800000 | 479000000 |
| Sunday, January 1, 2023 | 1272700000 | 2870000000 |
| Monday, January 1, 2024 | 0 |
Unleashing the power of data
In the world of corporate finance, understanding a company's spending patterns can reveal much about its strategic priorities. This analysis compares the Selling, General, and Administrative (SG&A) expenses of Ingersoll Rand Inc. and Rentokil Initial plc from 2014 to 2023. Over this period, Rentokil Initial plc consistently outspent Ingersoll Rand Inc., with a notable peak in 2023 where Rentokil's SG&A expenses were more than double those of Ingersoll Rand.
These trends highlight the dynamic nature of corporate strategies and their financial implications.
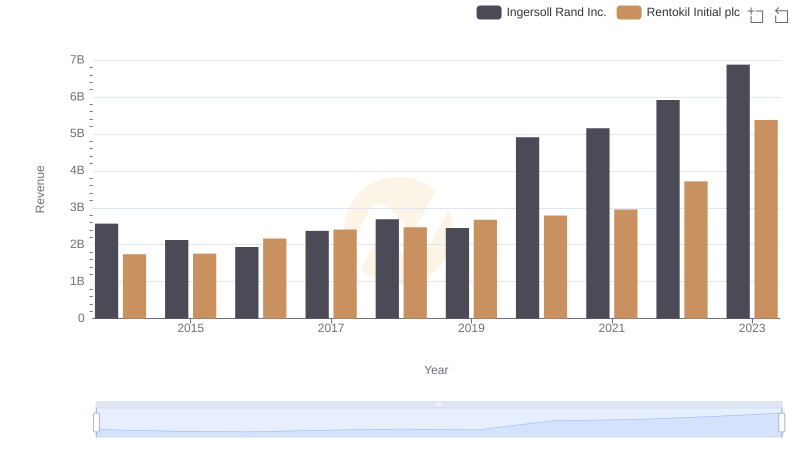
Comparing Revenue Performance: Ingersoll Rand Inc. or Rentokil Initial plc?
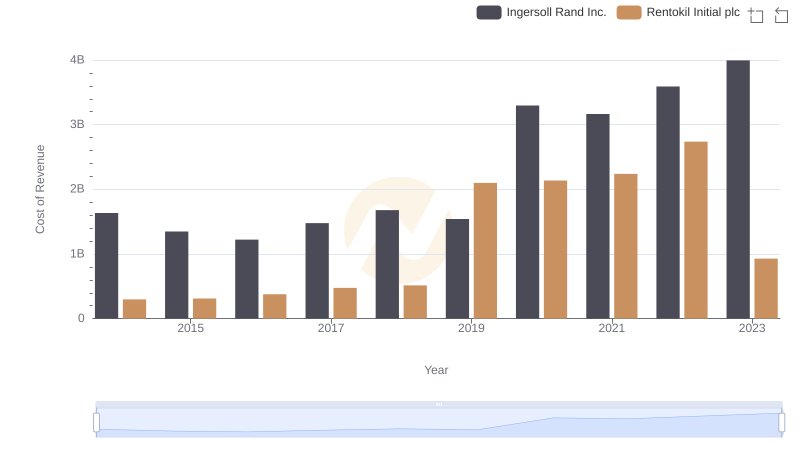
Cost of Revenue Comparison: Ingersoll Rand Inc. vs Rentokil Initial plc
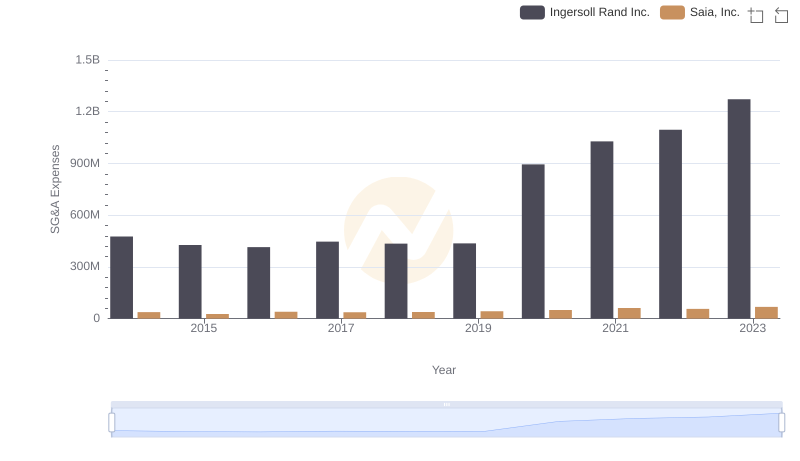
SG&A Efficiency Analysis: Comparing Ingersoll Rand Inc. and Saia, Inc.
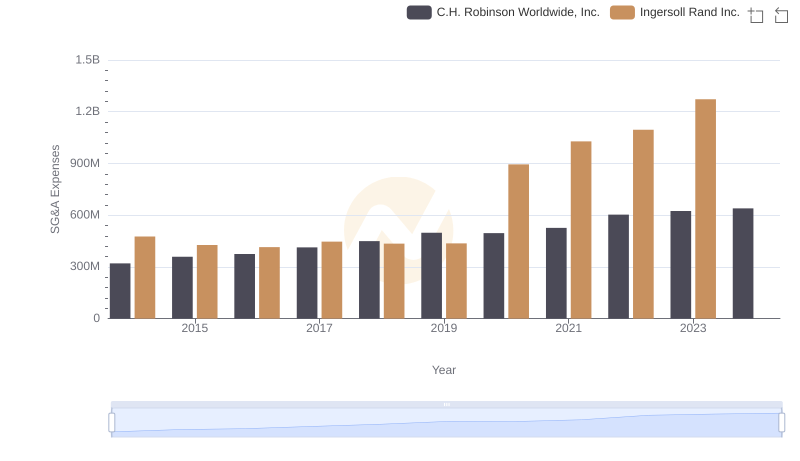
Breaking Down SG&A Expenses: Ingersoll Rand Inc. vs C.H. Robinson Worldwide, Inc.
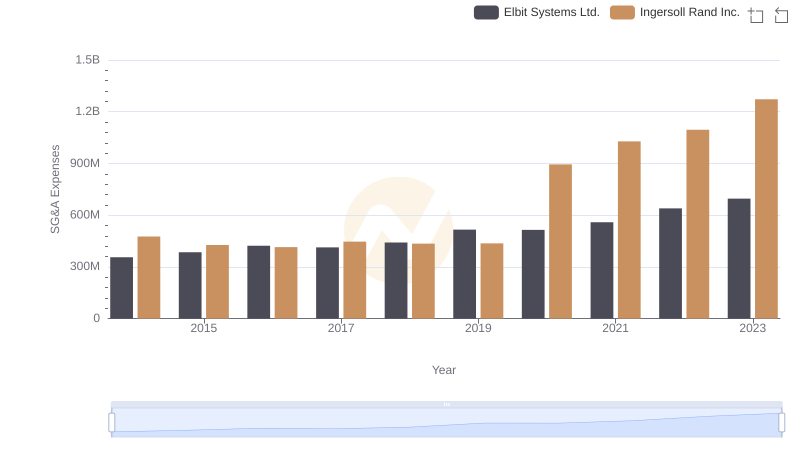
SG&A Efficiency Analysis: Comparing Ingersoll Rand Inc. and Elbit Systems Ltd.
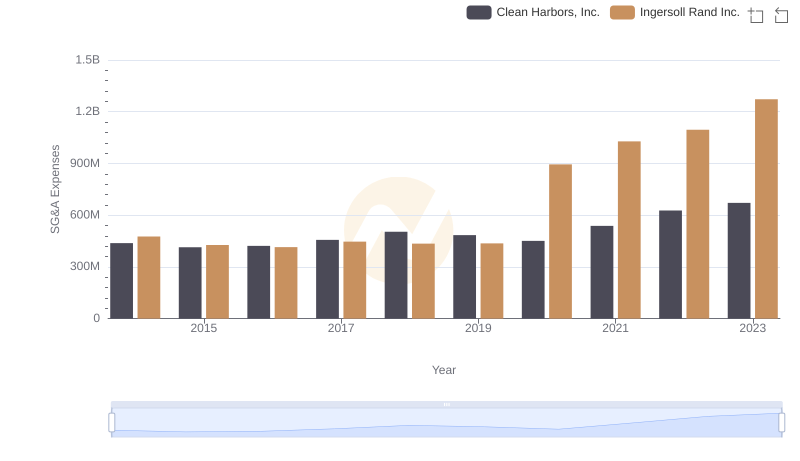
Ingersoll Rand Inc. vs Clean Harbors, Inc.: SG&A Expense Trends
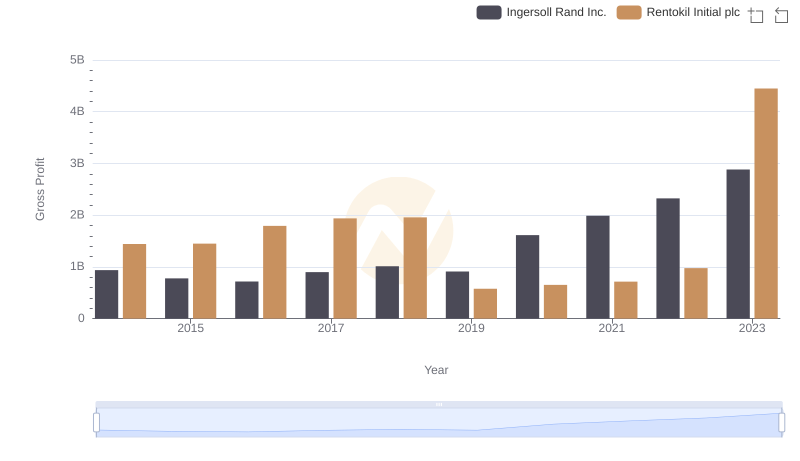
Gross Profit Comparison: Ingersoll Rand Inc. and Rentokil Initial plc Trends
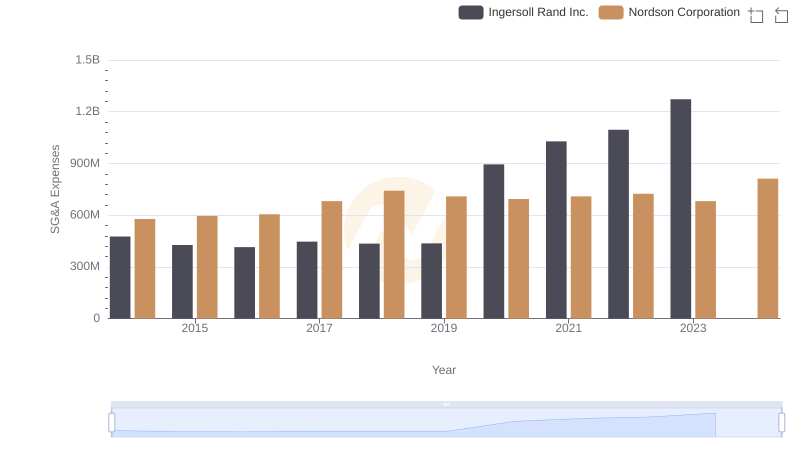
Breaking Down SG&A Expenses: Ingersoll Rand Inc. vs Nordson Corporation
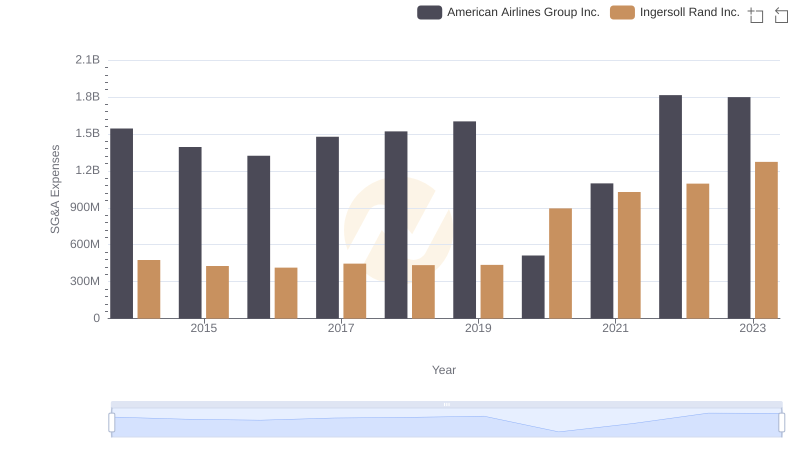
Cost Management Insights: SG&A Expenses for Ingersoll Rand Inc. and American Airlines Group Inc.