| __timestamp | Cisco Systems, Inc. | Super Micro Computer, Inc. |
|---|---|---|
| Wednesday, January 1, 2014 | 19373000000 | 1241657000 |
| Thursday, January 1, 2015 | 19480000000 | 1670924000 |
| Friday, January 1, 2016 | 18287000000 | 1884048000 |
| Sunday, January 1, 2017 | 17781000000 | 2171349000 |
| Monday, January 1, 2018 | 18724000000 | 2930498000 |
| Tuesday, January 1, 2019 | 19238000000 | 3004838000 |
| Wednesday, January 1, 2020 | 17618000000 | 2813071000 |
| Friday, January 1, 2021 | 17924000000 | 3022884000 |
| Saturday, January 1, 2022 | 19309000000 | 4396098000 |
| Sunday, January 1, 2023 | 21245000000 | 5840470000 |
| Monday, January 1, 2024 | 18975000000 | 12831125000 |
Igniting the spark of knowledge
In the ever-evolving tech landscape, understanding cost structures is pivotal. Over the past decade, Cisco Systems, Inc. and Super Micro Computer, Inc. have showcased contrasting cost of revenue trends. Cisco, a stalwart in networking, maintained a relatively stable cost of revenue, averaging around $18.9 billion annually. However, a notable peak occurred in 2023, with costs surging by approximately 10% compared to 2020.
Conversely, Super Micro, a key player in server technology, experienced a dramatic rise. From 2014 to 2024, their cost of revenue skyrocketed by over 900%, reflecting their aggressive market expansion and increased production capabilities. This divergence highlights the strategic differences between a mature giant and a rapidly growing contender. As the tech industry continues to innovate, these cost dynamics offer a glimpse into the operational strategies shaping the future.
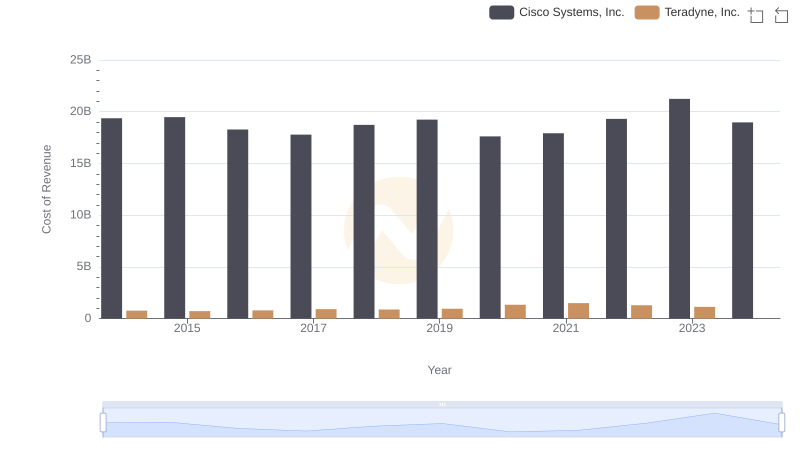
Cost of Revenue Comparison: Cisco Systems, Inc. vs Teradyne, Inc.
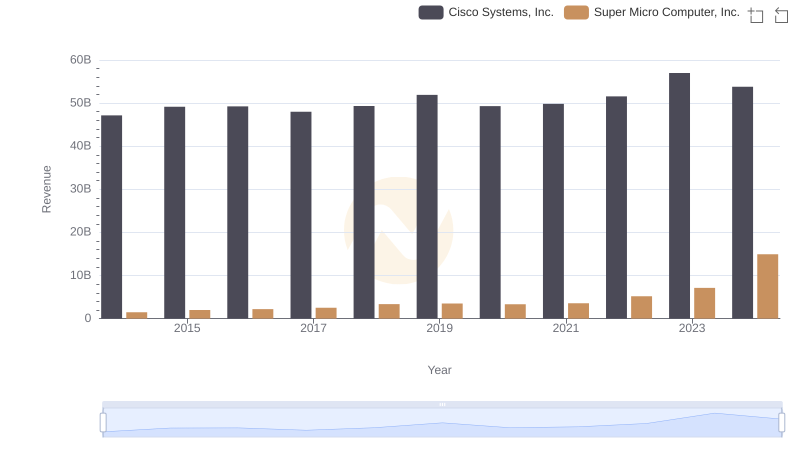
Cisco Systems, Inc. vs Super Micro Computer, Inc.: Examining Key Revenue Metrics
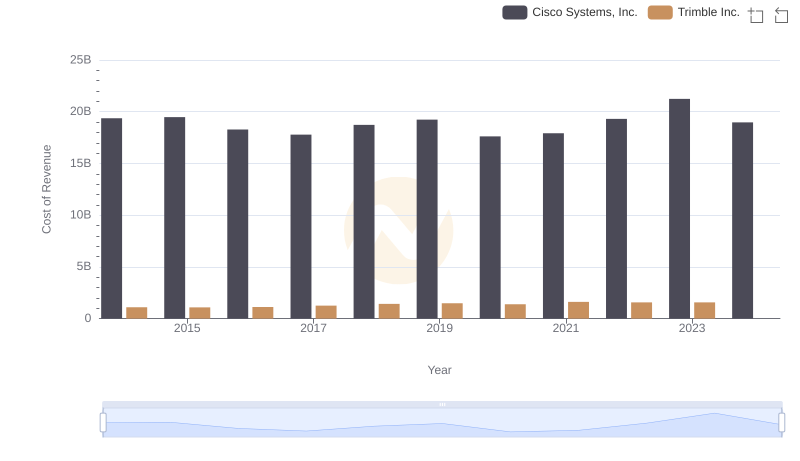
Cost Insights: Breaking Down Cisco Systems, Inc. and Trimble Inc.'s Expenses
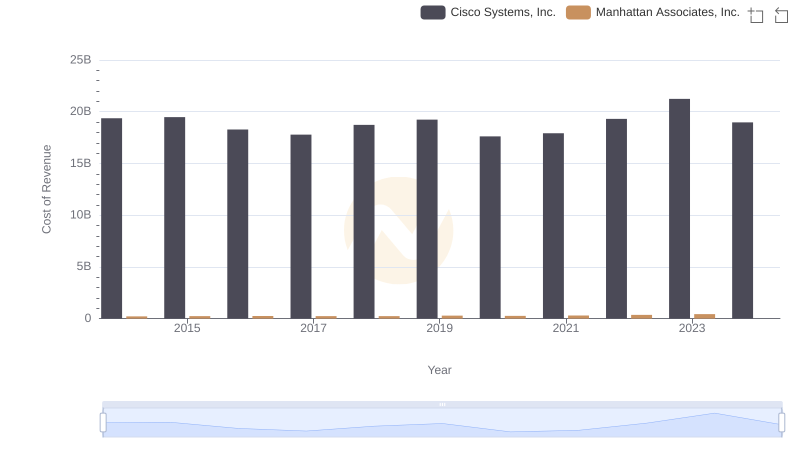
Cisco Systems, Inc. vs Manhattan Associates, Inc.: Efficiency in Cost of Revenue Explored
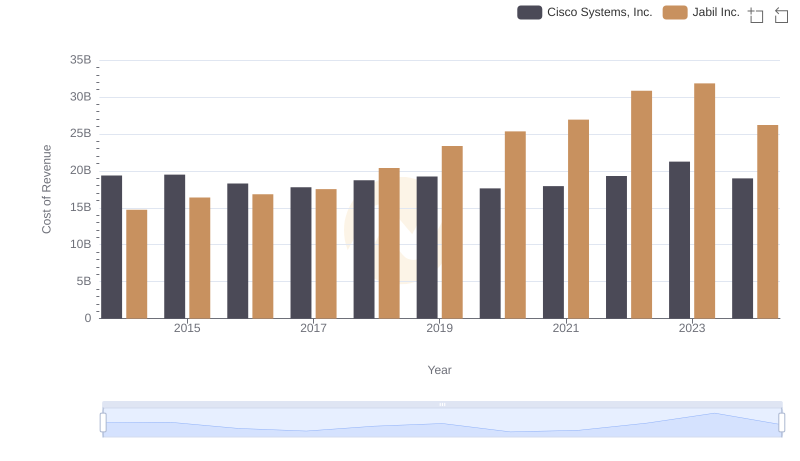
Analyzing Cost of Revenue: Cisco Systems, Inc. and Jabil Inc.
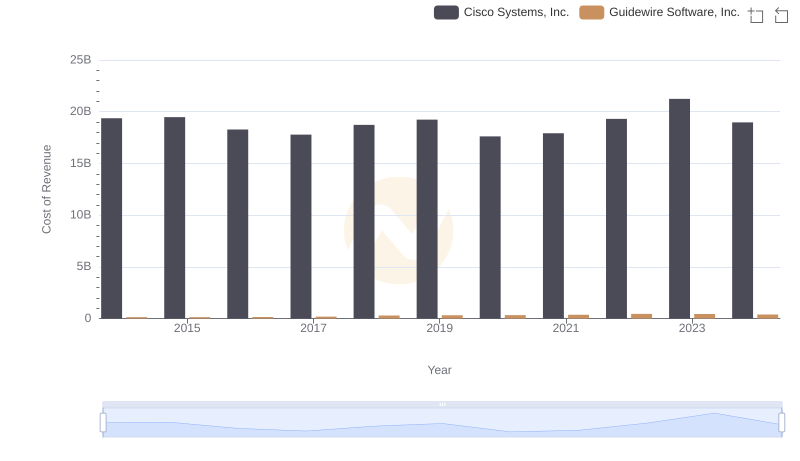
Cost of Revenue Trends: Cisco Systems, Inc. vs Guidewire Software, Inc.
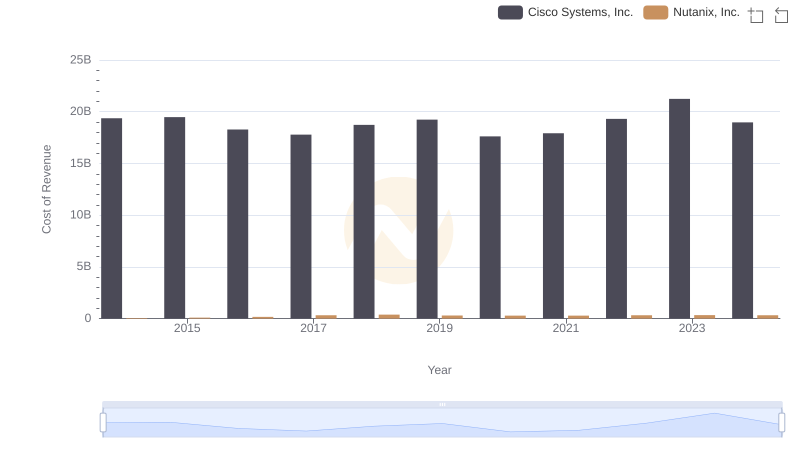
Cost Insights: Breaking Down Cisco Systems, Inc. and Nutanix, Inc.'s Expenses
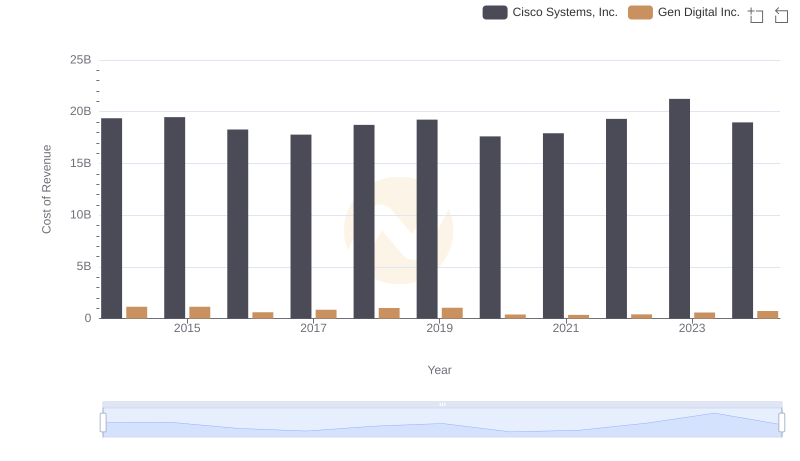
Comparing Cost of Revenue Efficiency: Cisco Systems, Inc. vs Gen Digital Inc.

Cisco Systems, Inc. vs Super Micro Computer, Inc.: A Gross Profit Performance Breakdown
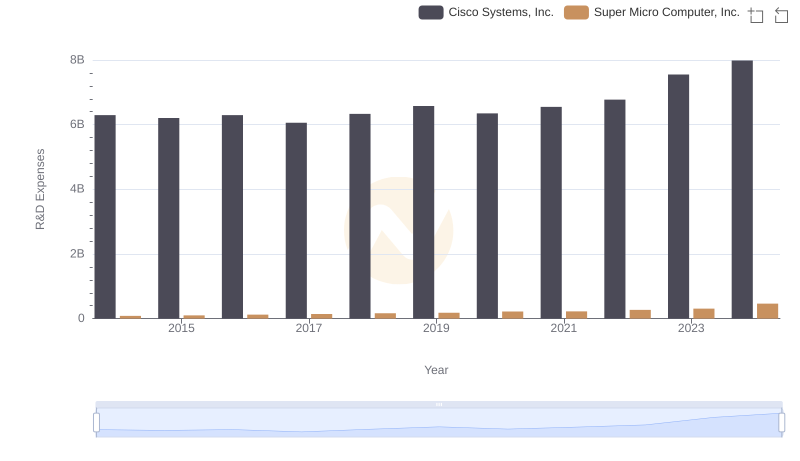
Research and Development Expenses Breakdown: Cisco Systems, Inc. vs Super Micro Computer, Inc.
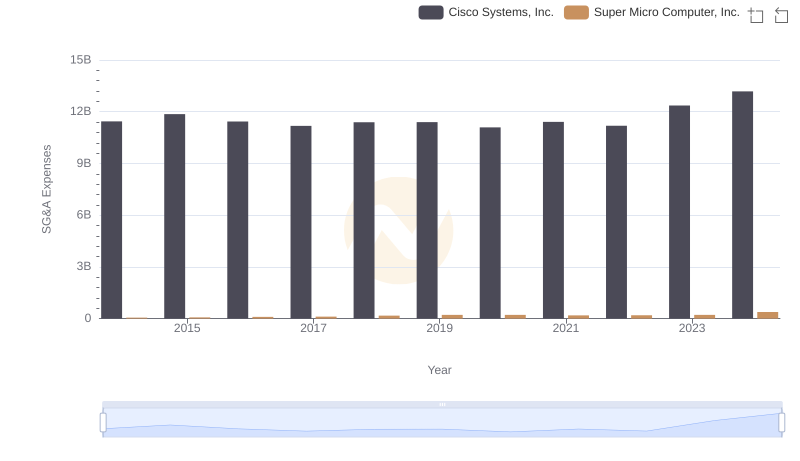
Cisco Systems, Inc. and Super Micro Computer, Inc.: SG&A Spending Patterns Compared
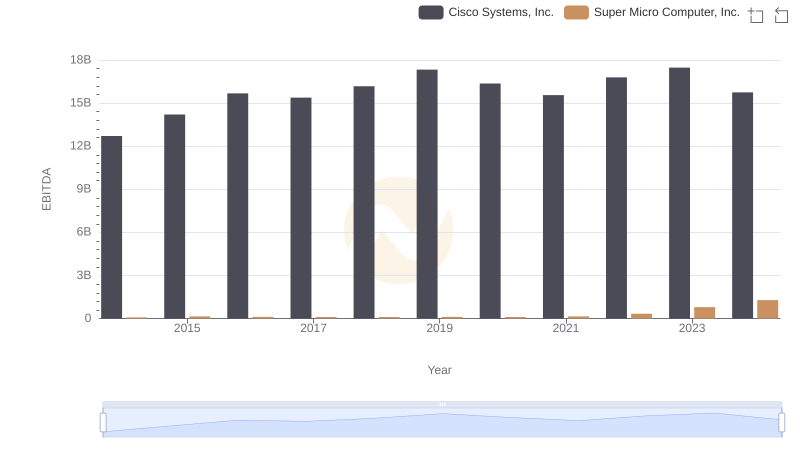
EBITDA Performance Review: Cisco Systems, Inc. vs Super Micro Computer, Inc.