| __timestamp | Cisco Systems, Inc. | Nutanix, Inc. |
|---|---|---|
| Wednesday, January 1, 2014 | 19373000000 | 60912000 |
| Thursday, January 1, 2015 | 19480000000 | 100959000 |
| Friday, January 1, 2016 | 18287000000 | 170787000 |
| Sunday, January 1, 2017 | 17781000000 | 327331000 |
| Monday, January 1, 2018 | 18724000000 | 386030000 |
| Tuesday, January 1, 2019 | 19238000000 | 304128000 |
| Wednesday, January 1, 2020 | 17618000000 | 286689000 |
| Friday, January 1, 2021 | 17924000000 | 291906000 |
| Saturday, January 1, 2022 | 19309000000 | 321156000 |
| Sunday, January 1, 2023 | 21245000000 | 332187000 |
| Monday, January 1, 2024 | 18975000000 | 324112000 |
Cracking the code
In the ever-evolving tech landscape, understanding cost structures is pivotal. Cisco Systems, Inc., a stalwart in networking, and Nutanix, Inc., a cloud computing innovator, present intriguing contrasts in their cost of revenue from 2014 to 2024. Cisco's cost of revenue, averaging around $18.9 billion annually, showcases a stable yet slightly fluctuating trend, peaking in 2023 with a 10% increase from 2014. In contrast, Nutanix, with a more modest average of $264 million, exhibits a dynamic growth trajectory, surging over 400% from 2014 to 2023. This divergence highlights Cisco's established market presence versus Nutanix's rapid expansion. As we delve into these insights, the data underscores the strategic financial maneuvers each company employs to navigate the competitive tech industry. Such analyses are crucial for investors and stakeholders aiming to make informed decisions in a rapidly changing market.
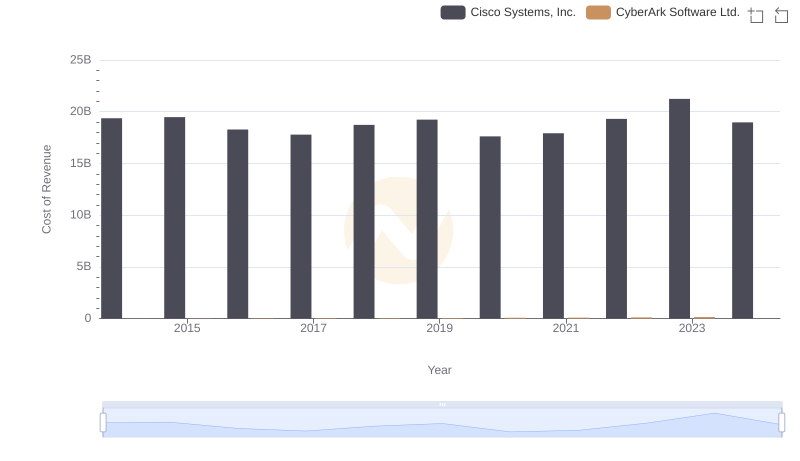
Cisco Systems, Inc. vs CyberArk Software Ltd.: Efficiency in Cost of Revenue Explored
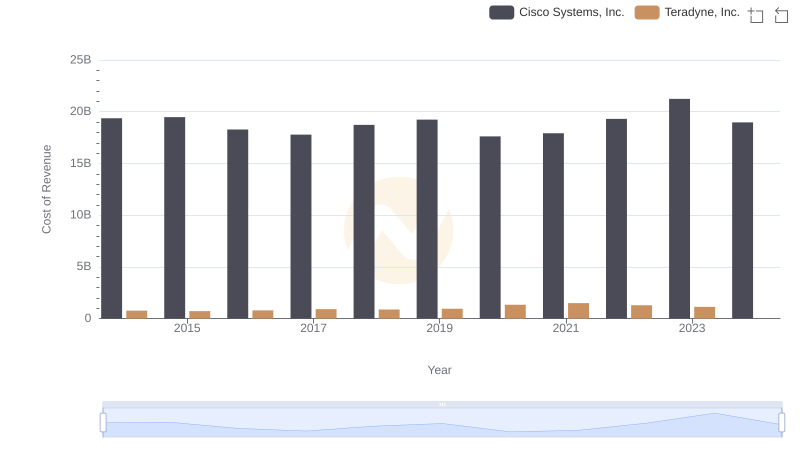
Cost of Revenue Comparison: Cisco Systems, Inc. vs Teradyne, Inc.
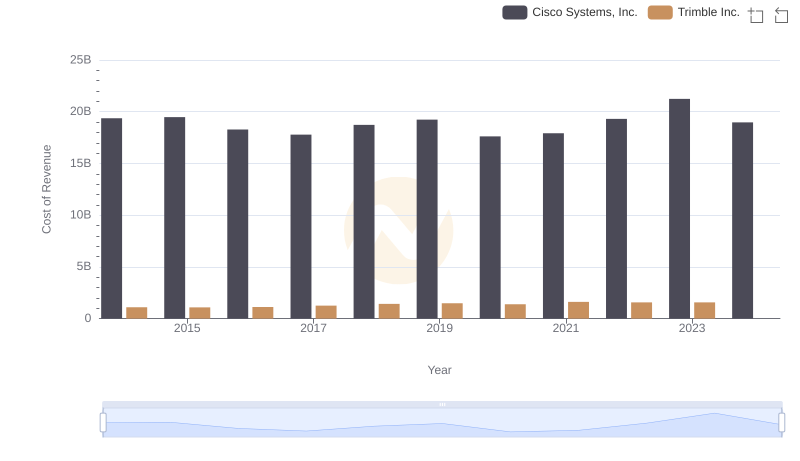
Cost Insights: Breaking Down Cisco Systems, Inc. and Trimble Inc.'s Expenses
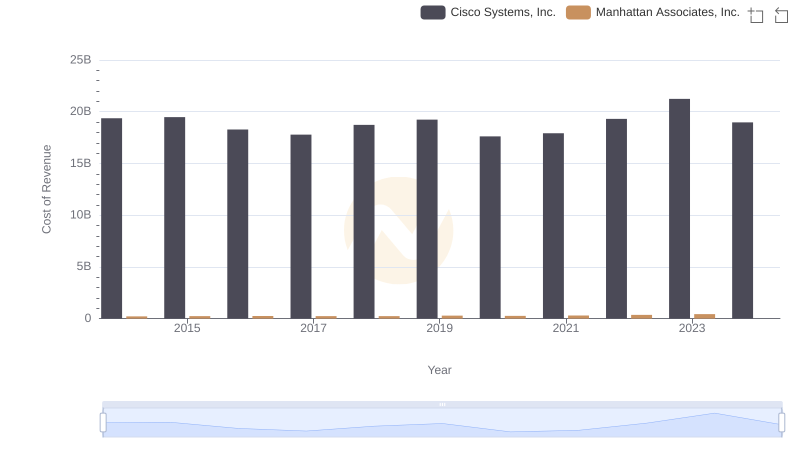
Cisco Systems, Inc. vs Manhattan Associates, Inc.: Efficiency in Cost of Revenue Explored
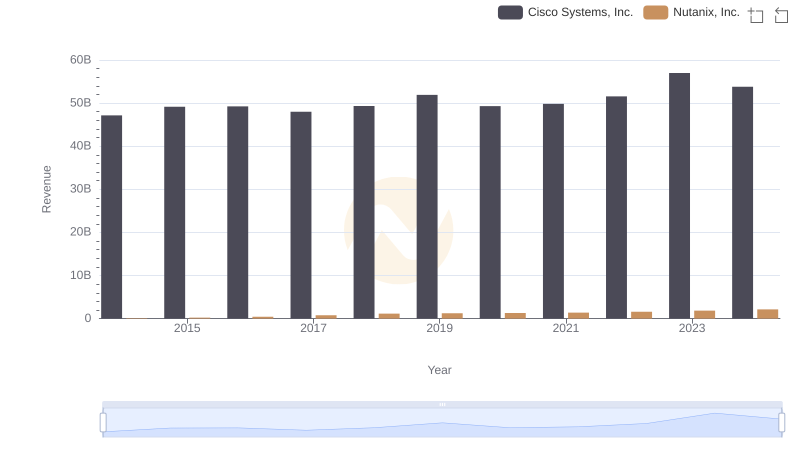
Comparing Revenue Performance: Cisco Systems, Inc. or Nutanix, Inc.?
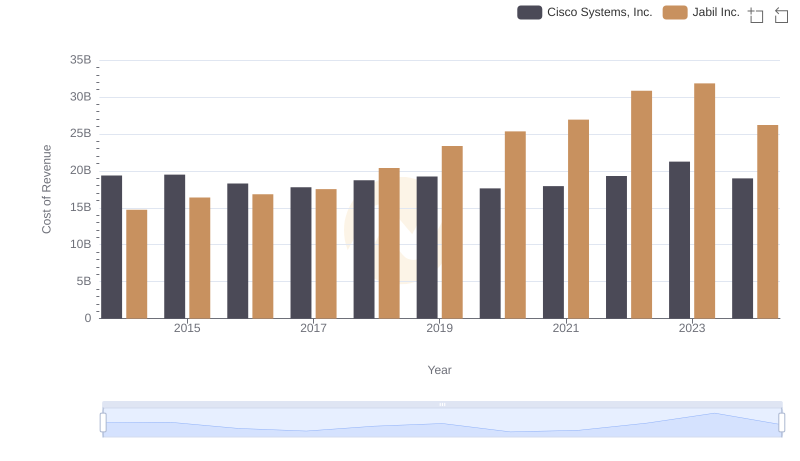
Analyzing Cost of Revenue: Cisco Systems, Inc. and Jabil Inc.
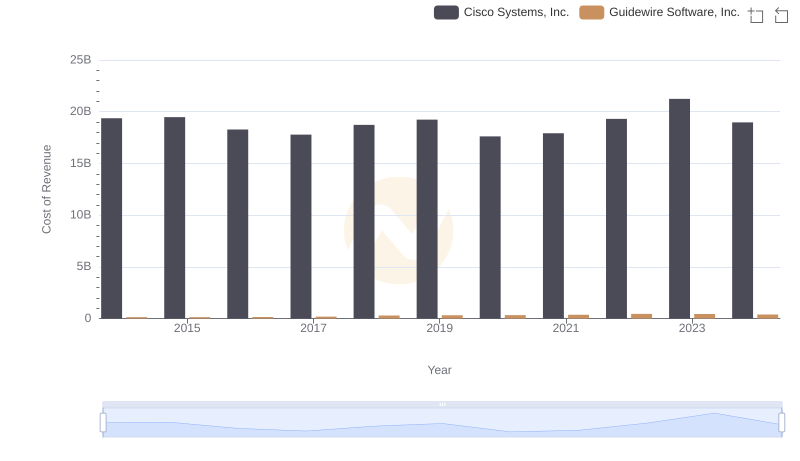
Cost of Revenue Trends: Cisco Systems, Inc. vs Guidewire Software, Inc.
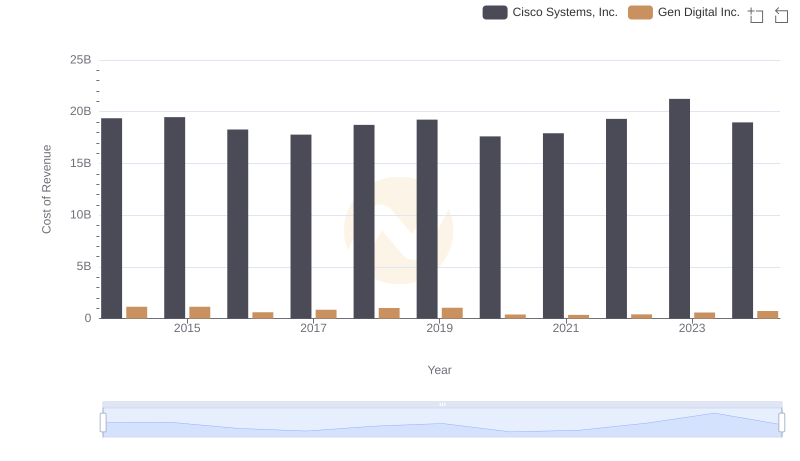
Comparing Cost of Revenue Efficiency: Cisco Systems, Inc. vs Gen Digital Inc.
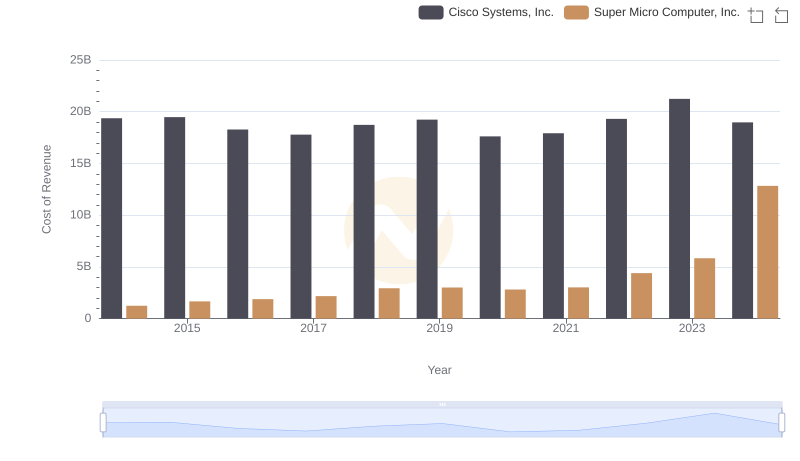
Cost of Revenue Comparison: Cisco Systems, Inc. vs Super Micro Computer, Inc.

Who Generates Higher Gross Profit? Cisco Systems, Inc. or Nutanix, Inc.
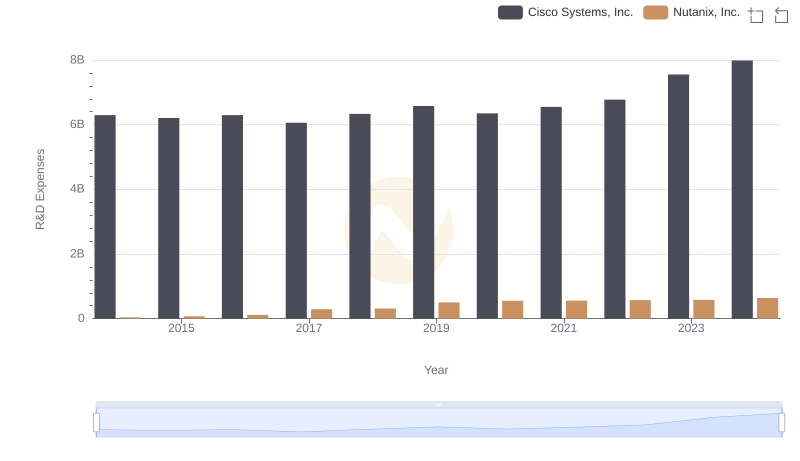
Research and Development Expenses Breakdown: Cisco Systems, Inc. vs Nutanix, Inc.
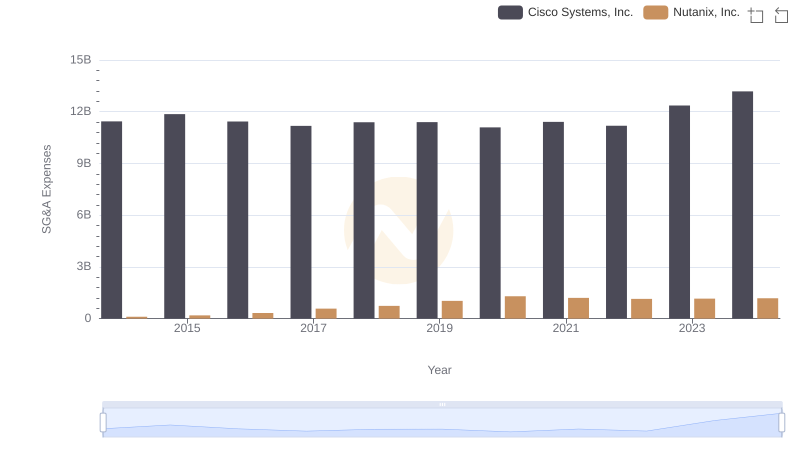
Breaking Down SG&A Expenses: Cisco Systems, Inc. vs Nutanix, Inc.