| __timestamp | Cisco Systems, Inc. | Manhattan Associates, Inc. |
|---|---|---|
| Wednesday, January 1, 2014 | 19373000000 | 212578000 |
| Thursday, January 1, 2015 | 19480000000 | 235428000 |
| Friday, January 1, 2016 | 18287000000 | 249879000 |
| Sunday, January 1, 2017 | 17781000000 | 245733000 |
| Monday, January 1, 2018 | 18724000000 | 240881000 |
| Tuesday, January 1, 2019 | 19238000000 | 284967000 |
| Wednesday, January 1, 2020 | 17618000000 | 269887000 |
| Friday, January 1, 2021 | 17924000000 | 297827000 |
| Saturday, January 1, 2022 | 19309000000 | 358237000 |
| Sunday, January 1, 2023 | 21245000000 | 430614000 |
| Monday, January 1, 2024 | 18975000000 | 470980000 |
Infusing magic into the data realm
In the ever-evolving tech industry, cost efficiency remains a pivotal factor for success. This analysis delves into the cost of revenue trends for Cisco Systems, Inc. and Manhattan Associates, Inc. from 2014 to 2023. Over this decade, Cisco's cost of revenue fluctuated, peaking in 2023 with a 10% increase from 2014. Meanwhile, Manhattan Associates exhibited a more volatile pattern, with a notable 102% rise in 2023 compared to 2014.
Cisco's consistent cost management reflects its robust operational strategies, while Manhattan's sharp increase in 2023 suggests a potential shift in business dynamics. Interestingly, 2024 data for Manhattan is missing, indicating a possible strategic pivot or data reporting anomaly. This comparative analysis underscores the importance of cost efficiency in maintaining competitive advantage in the tech sector.
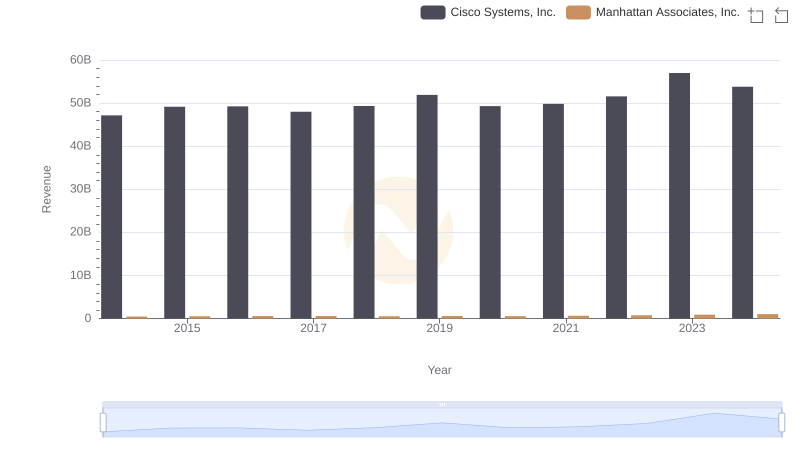
Cisco Systems, Inc. and Manhattan Associates, Inc.: A Comprehensive Revenue Analysis
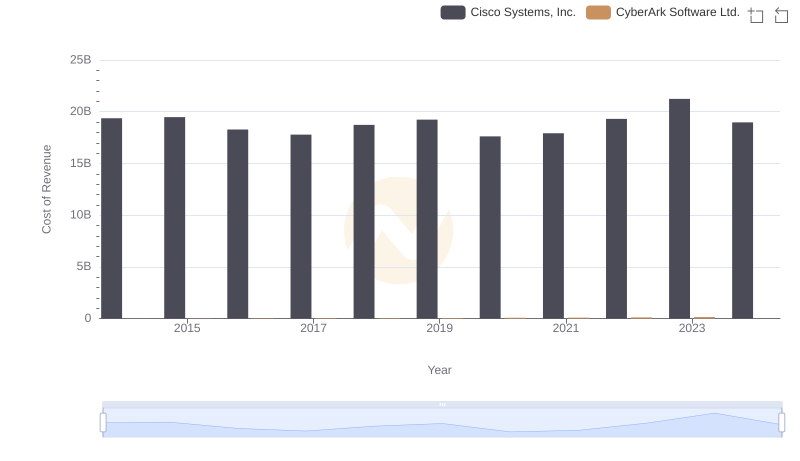
Cisco Systems, Inc. vs CyberArk Software Ltd.: Efficiency in Cost of Revenue Explored
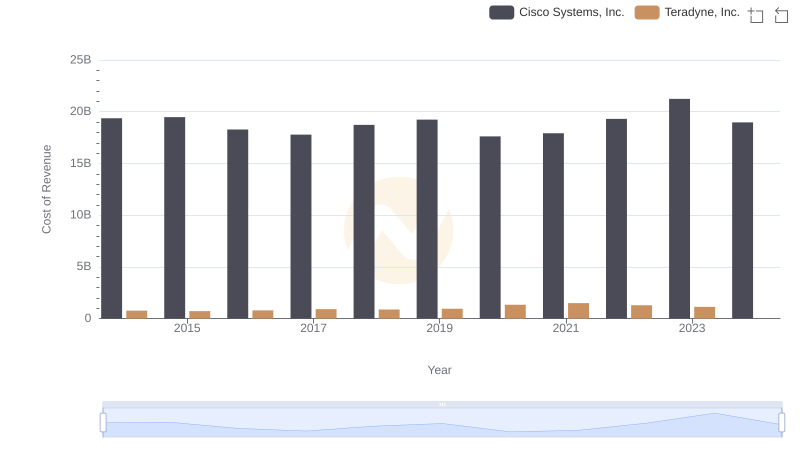
Cost of Revenue Comparison: Cisco Systems, Inc. vs Teradyne, Inc.
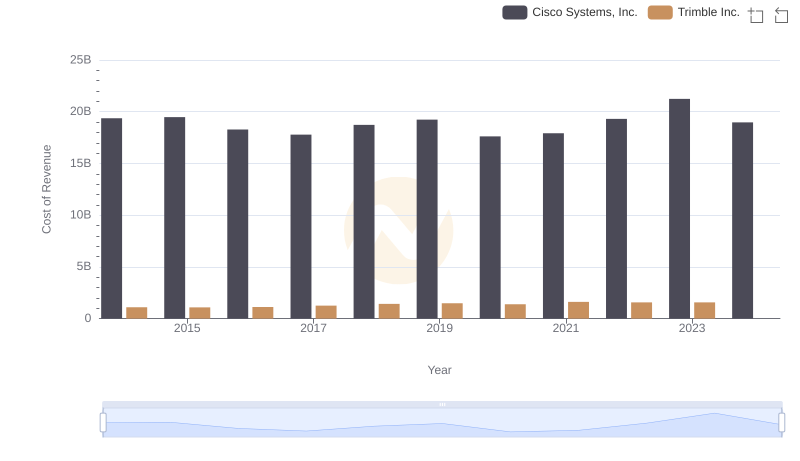
Cost Insights: Breaking Down Cisco Systems, Inc. and Trimble Inc.'s Expenses
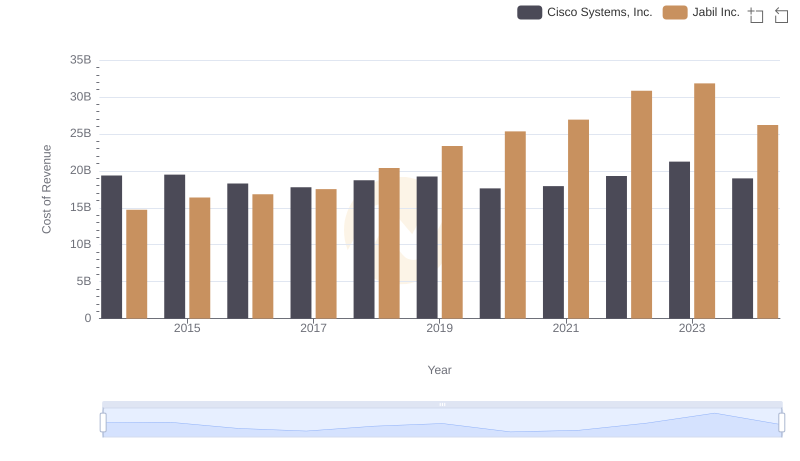
Analyzing Cost of Revenue: Cisco Systems, Inc. and Jabil Inc.
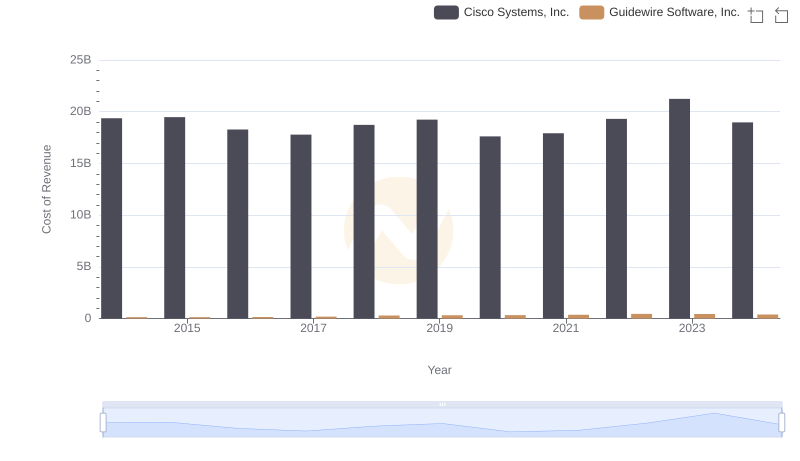
Cost of Revenue Trends: Cisco Systems, Inc. vs Guidewire Software, Inc.

Cisco Systems, Inc. and Manhattan Associates, Inc.: A Detailed Gross Profit Analysis
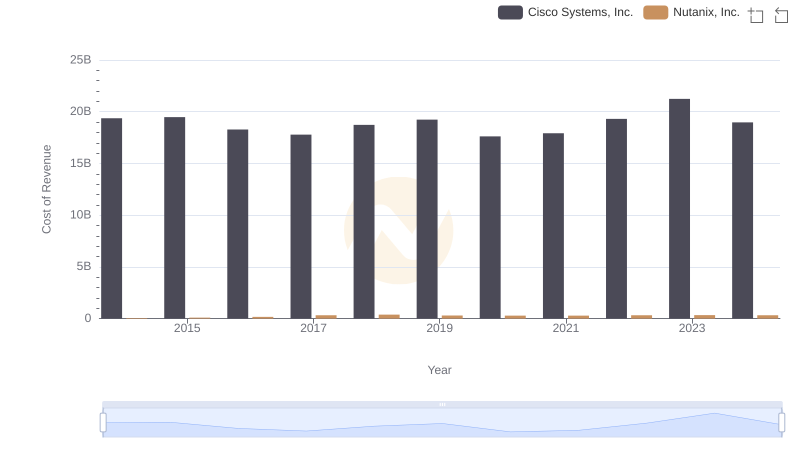
Cost Insights: Breaking Down Cisco Systems, Inc. and Nutanix, Inc.'s Expenses
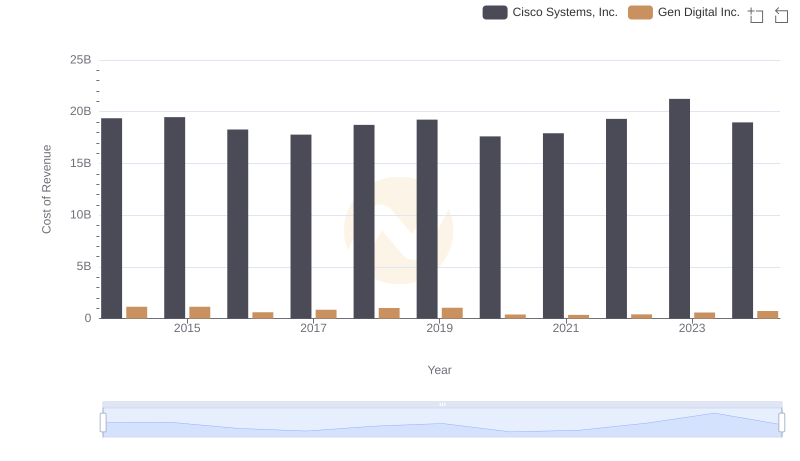
Comparing Cost of Revenue Efficiency: Cisco Systems, Inc. vs Gen Digital Inc.
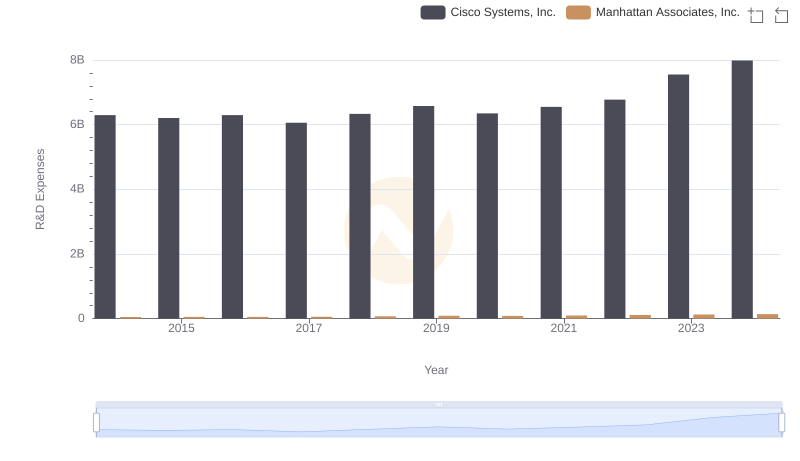
Comparing Innovation Spending: Cisco Systems, Inc. and Manhattan Associates, Inc.
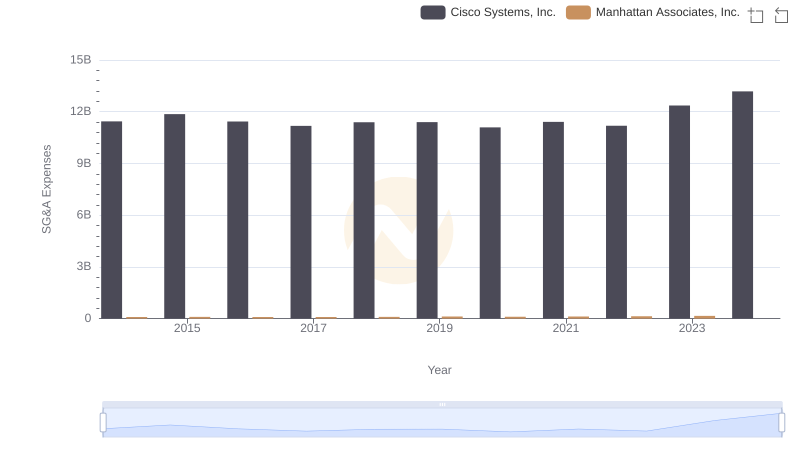
Who Optimizes SG&A Costs Better? Cisco Systems, Inc. or Manhattan Associates, Inc.
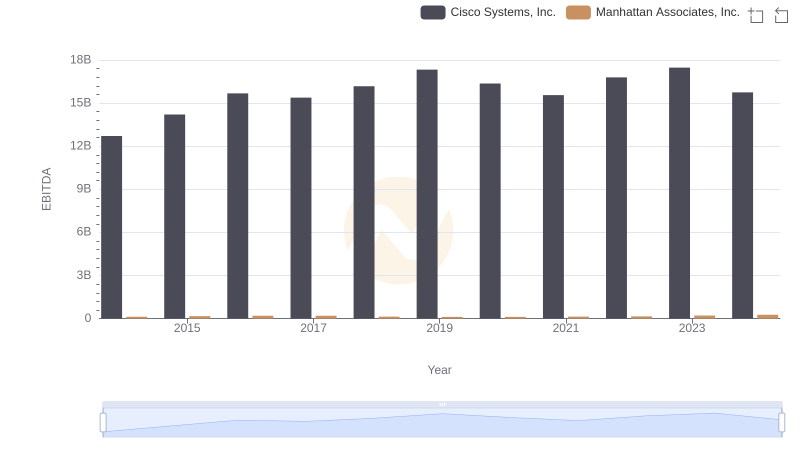
Cisco Systems, Inc. vs Manhattan Associates, Inc.: In-Depth EBITDA Performance Comparison