| __timestamp | Cisco Systems, Inc. | Super Micro Computer, Inc. |
|---|---|---|
| Wednesday, January 1, 2014 | 27769000000 | 225545000 |
| Thursday, January 1, 2015 | 29681000000 | 320231000 |
| Friday, January 1, 2016 | 30960000000 | 331525000 |
| Sunday, January 1, 2017 | 30224000000 | 358566000 |
| Monday, January 1, 2018 | 30606000000 | 429994000 |
| Tuesday, January 1, 2019 | 32666000000 | 495522000 |
| Wednesday, January 1, 2020 | 31683000000 | 526210000 |
| Friday, January 1, 2021 | 31894000000 | 534538000 |
| Saturday, January 1, 2022 | 32248000000 | 800001000 |
| Sunday, January 1, 2023 | 35753000000 | 1283012000 |
| Monday, January 1, 2024 | 34828000000 | 2111729000 |
In pursuit of knowledge
In the ever-evolving tech landscape, Cisco Systems, Inc. and Super Micro Computer, Inc. have carved distinct niches. From 2014 to 2024, Cisco's gross profit consistently dwarfed that of Super Micro, showcasing its dominance. Cisco's gross profit surged by approximately 25% over the decade, peaking in 2023 with a remarkable 35.8 billion USD. In contrast, Super Micro's growth trajectory was more volatile, yet impressive, with a nearly tenfold increase, reaching 2.1 billion USD in 2024. This stark contrast highlights Cisco's steady market leadership and Super Micro's dynamic growth strategy. As the tech industry continues to innovate, these financial trends offer a glimpse into the strategic maneuvers of these two powerhouses. The data underscores the importance of scale and adaptability in maintaining competitive advantage in the global market.
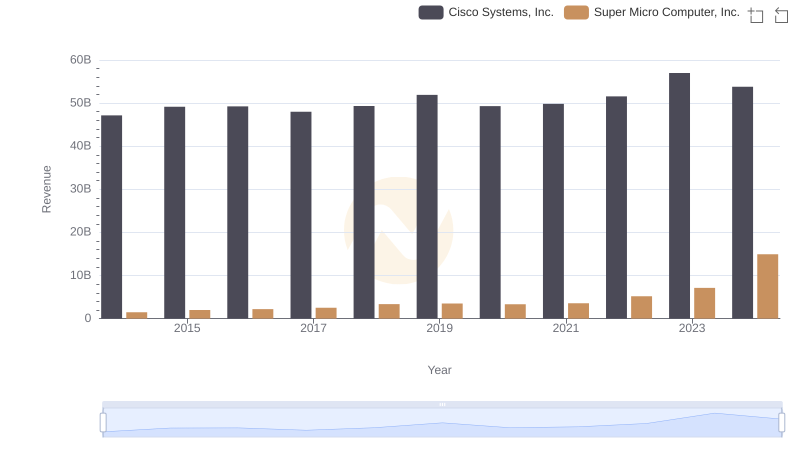
Cisco Systems, Inc. vs Super Micro Computer, Inc.: Examining Key Revenue Metrics

Cisco Systems, Inc. and Manhattan Associates, Inc.: A Detailed Gross Profit Analysis

Gross Profit Comparison: Cisco Systems, Inc. and Teradyne, Inc. Trends
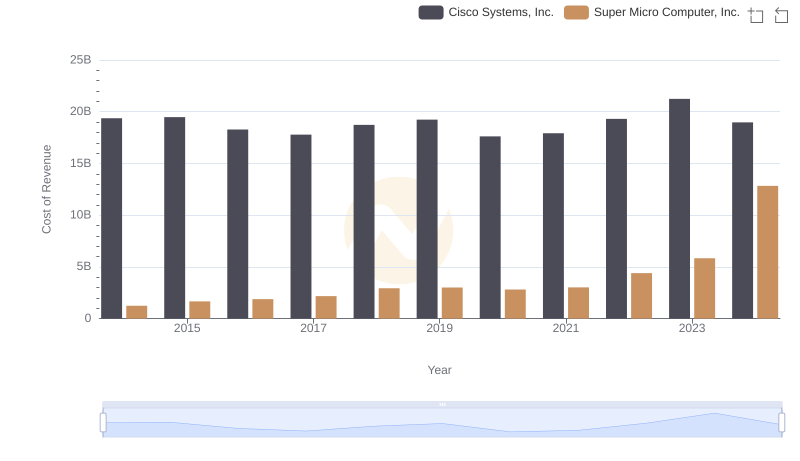
Cost of Revenue Comparison: Cisco Systems, Inc. vs Super Micro Computer, Inc.
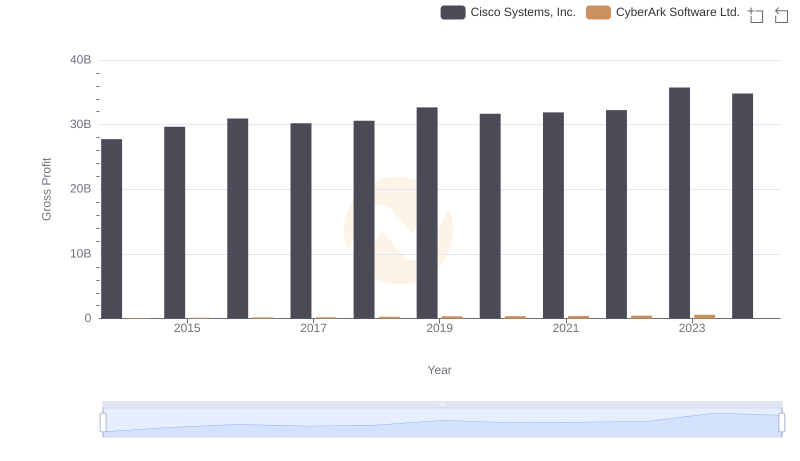
Gross Profit Analysis: Comparing Cisco Systems, Inc. and CyberArk Software Ltd.

Gross Profit Analysis: Comparing Cisco Systems, Inc. and Guidewire Software, Inc.
Cisco Systems, Inc. and Jabil Inc.: A Detailed Gross Profit Analysis

Who Generates Higher Gross Profit? Cisco Systems, Inc. or Nutanix, Inc.
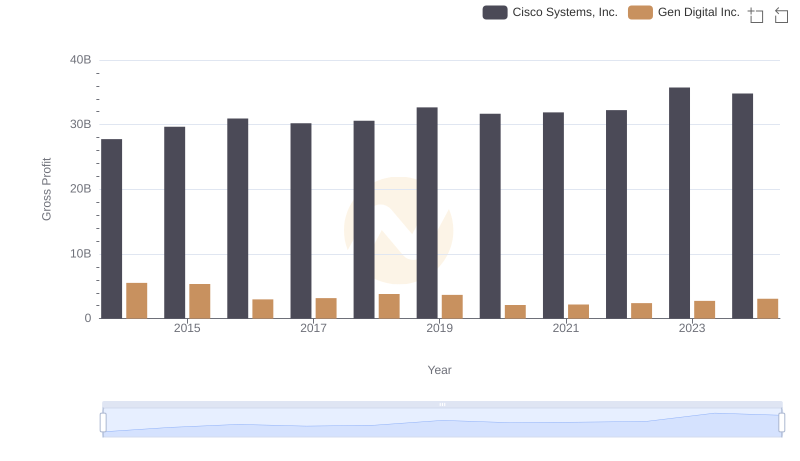
Gross Profit Trends Compared: Cisco Systems, Inc. vs Gen Digital Inc.
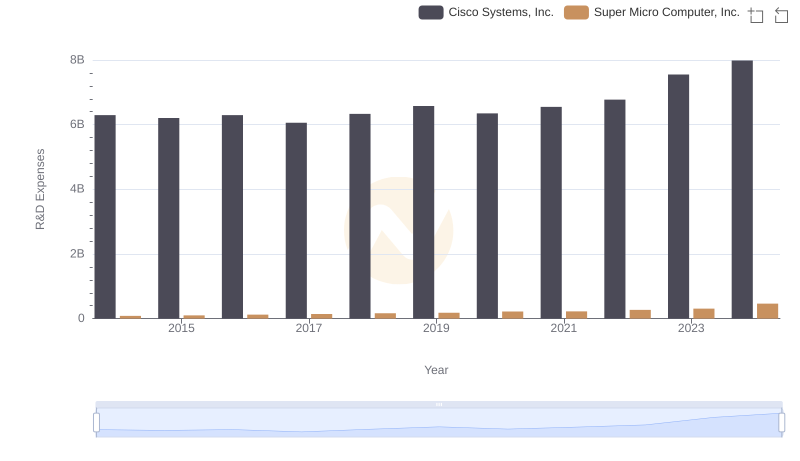
Research and Development Expenses Breakdown: Cisco Systems, Inc. vs Super Micro Computer, Inc.
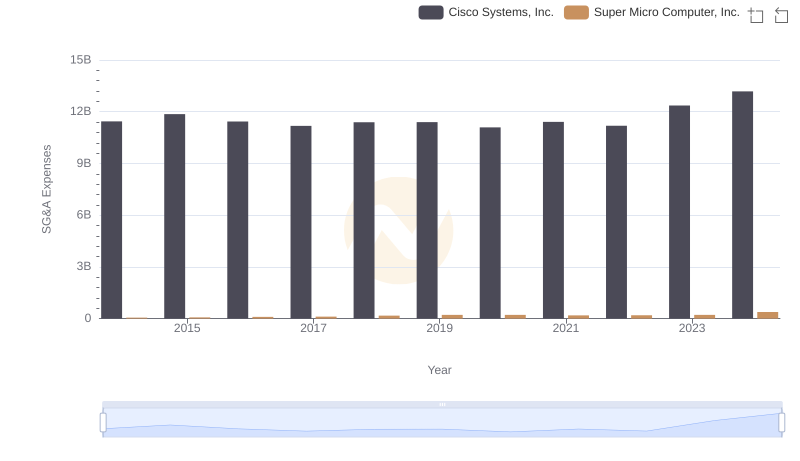
Cisco Systems, Inc. and Super Micro Computer, Inc.: SG&A Spending Patterns Compared
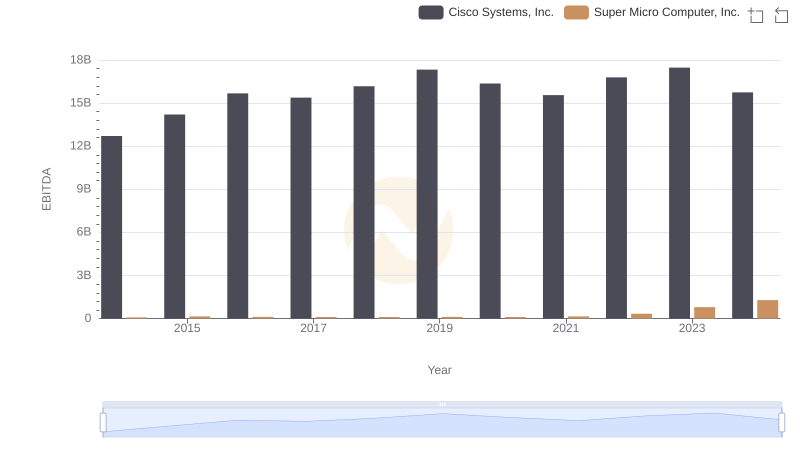
EBITDA Performance Review: Cisco Systems, Inc. vs Super Micro Computer, Inc.