| __timestamp | Cisco Systems, Inc. | Super Micro Computer, Inc. |
|---|---|---|
| Wednesday, January 1, 2014 | 11437000000 | 61029000 |
| Thursday, January 1, 2015 | 11861000000 | 73228000 |
| Friday, January 1, 2016 | 11433000000 | 100681000 |
| Sunday, January 1, 2017 | 11177000000 | 115331000 |
| Monday, January 1, 2018 | 11386000000 | 170176000 |
| Tuesday, January 1, 2019 | 11398000000 | 218382000 |
| Wednesday, January 1, 2020 | 11094000000 | 219078000 |
| Friday, January 1, 2021 | 11411000000 | 186222000 |
| Saturday, January 1, 2022 | 11186000000 | 192561000 |
| Sunday, January 1, 2023 | 12358000000 | 214610000 |
| Monday, January 1, 2024 | 13177000000 | 383111000 |
Unleashing insights
In the ever-evolving tech industry, understanding financial strategies is crucial. This analysis delves into the Selling, General, and Administrative (SG&A) expenses of two tech giants: Cisco Systems, Inc. and Super Micro Computer, Inc., from 2014 to 2024. Cisco, a leader in networking solutions, consistently allocated substantial resources to SG&A, with a notable increase of 15% from 2014 to 2024. In contrast, Super Micro, known for its high-performance computing solutions, exhibited a remarkable 528% surge in SG&A spending over the same period. This disparity highlights Cisco's steady approach versus Super Micro's aggressive expansion strategy. The data reveals that while Cisco's SG&A expenses peaked in 2024, Super Micro's spending pattern suggests a strategic pivot towards growth. These insights offer a glimpse into the financial maneuvers shaping the competitive landscape of the tech industry.
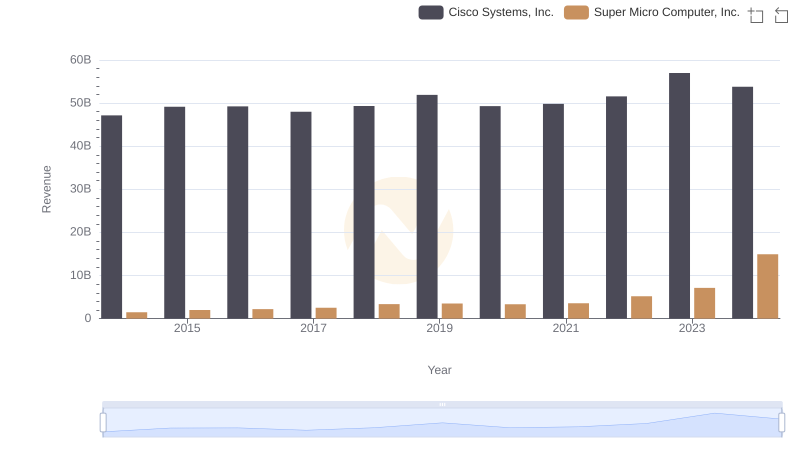
Cisco Systems, Inc. vs Super Micro Computer, Inc.: Examining Key Revenue Metrics
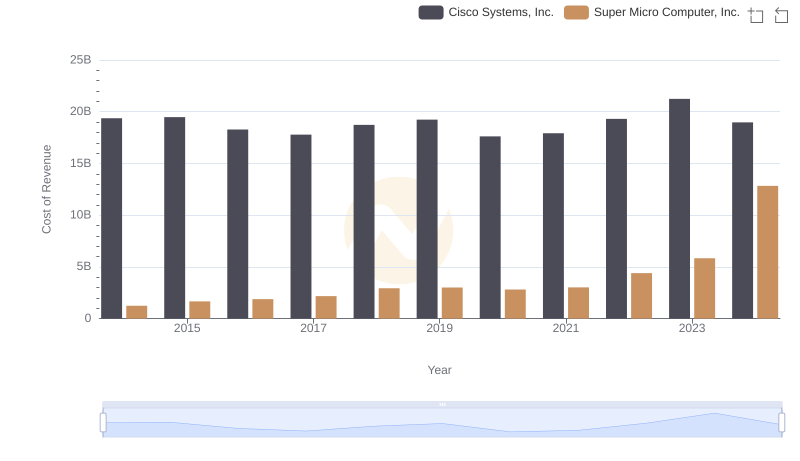
Cost of Revenue Comparison: Cisco Systems, Inc. vs Super Micro Computer, Inc.

Cisco Systems, Inc. vs Super Micro Computer, Inc.: A Gross Profit Performance Breakdown
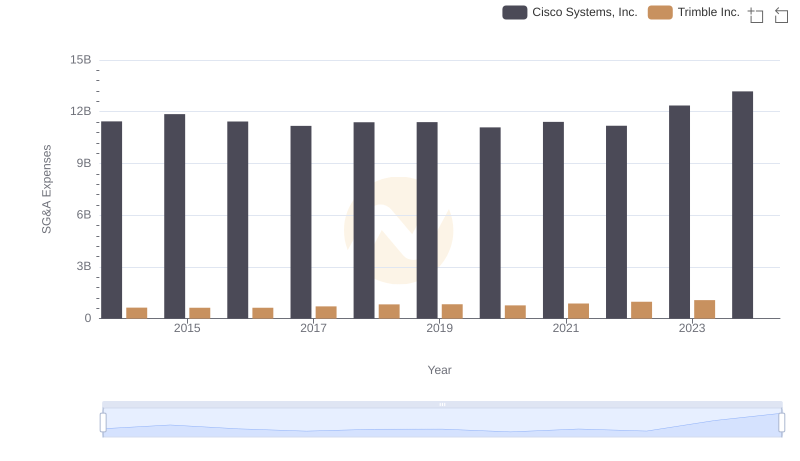
Cost Management Insights: SG&A Expenses for Cisco Systems, Inc. and Trimble Inc.
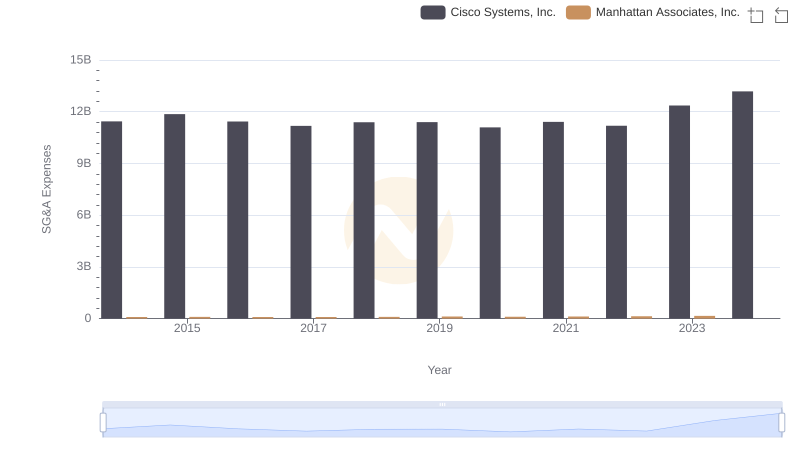
Who Optimizes SG&A Costs Better? Cisco Systems, Inc. or Manhattan Associates, Inc.

SG&A Efficiency Analysis: Comparing Cisco Systems, Inc. and CyberArk Software Ltd.
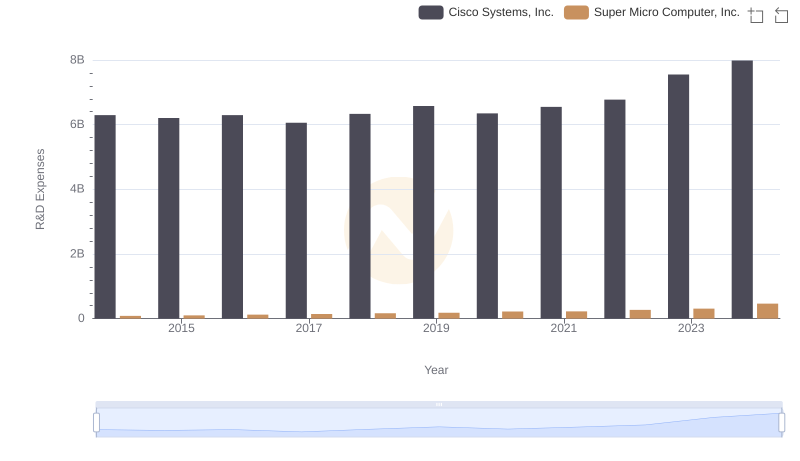
Research and Development Expenses Breakdown: Cisco Systems, Inc. vs Super Micro Computer, Inc.
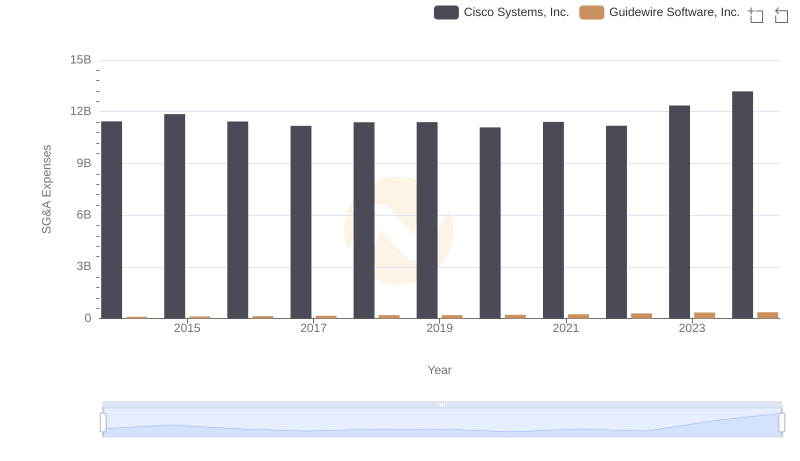
Cisco Systems, Inc. vs Guidewire Software, Inc.: SG&A Expense Trends
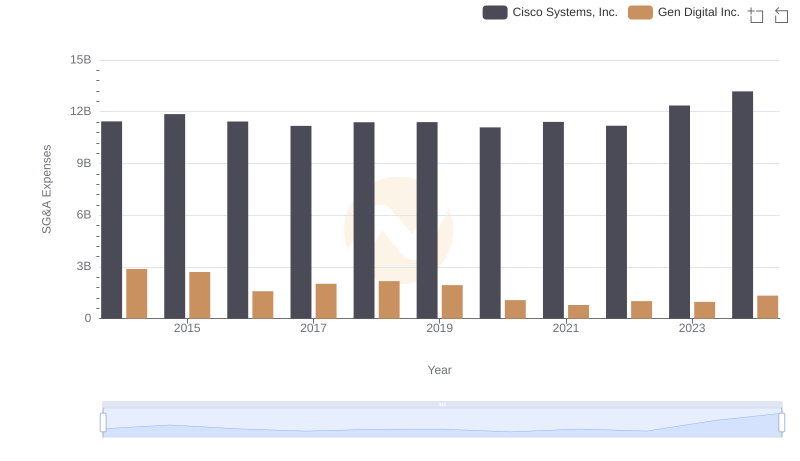
SG&A Efficiency Analysis: Comparing Cisco Systems, Inc. and Gen Digital Inc.
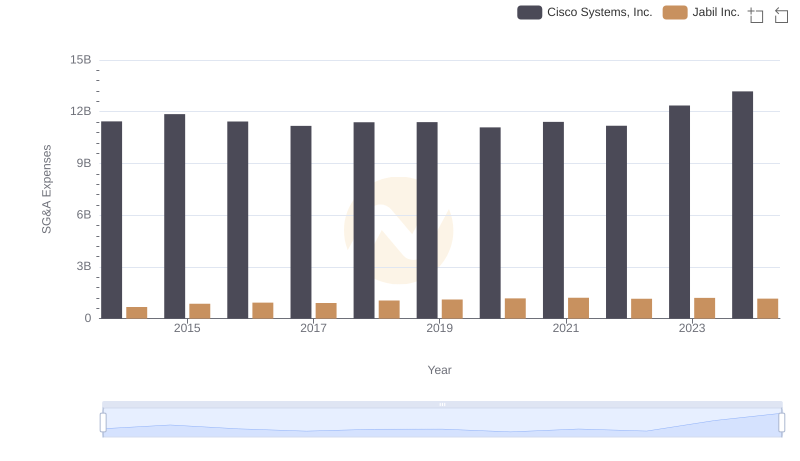
SG&A Efficiency Analysis: Comparing Cisco Systems, Inc. and Jabil Inc.
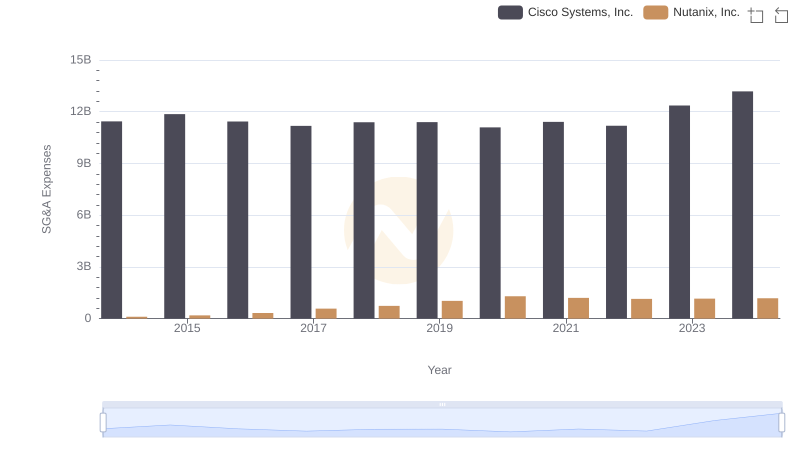
Breaking Down SG&A Expenses: Cisco Systems, Inc. vs Nutanix, Inc.
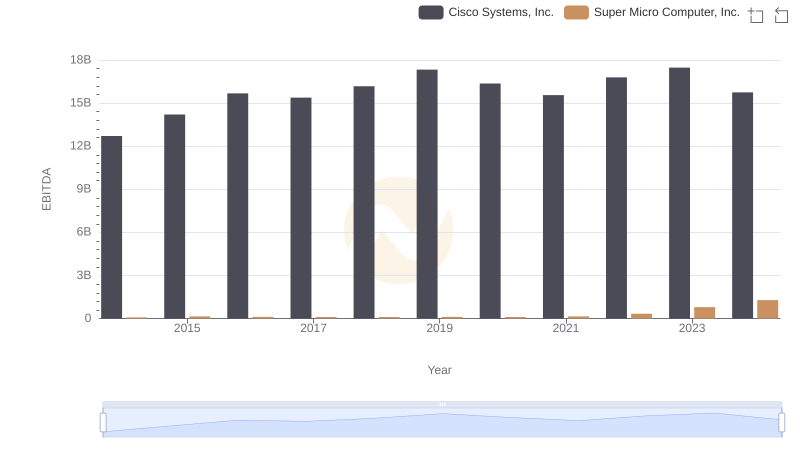
EBITDA Performance Review: Cisco Systems, Inc. vs Super Micro Computer, Inc.