| __timestamp | Cisco Systems, Inc. | Super Micro Computer, Inc. |
|---|---|---|
| Wednesday, January 1, 2014 | 12709000000 | 86715000 |
| Thursday, January 1, 2015 | 14209000000 | 154994000 |
| Friday, January 1, 2016 | 15678000000 | 120773000 |
| Sunday, January 1, 2017 | 15383000000 | 111232000 |
| Monday, January 1, 2018 | 16172000000 | 115787000 |
| Tuesday, January 1, 2019 | 17334000000 | 120415000 |
| Wednesday, January 1, 2020 | 16363000000 | 114126000 |
| Friday, January 1, 2021 | 15558000000 | 152132000 |
| Saturday, January 1, 2022 | 16794000000 | 335167000 |
| Sunday, January 1, 2023 | 17471000000 | 796046000 |
| Monday, January 1, 2024 | 15747000000 | 1288409000 |
Unleashing the power of data
In the ever-evolving tech landscape, Cisco Systems, Inc. and Super Micro Computer, Inc. have carved distinct paths. Over the past decade, Cisco's EBITDA has shown a robust upward trend, peaking in 2023 with a 37% increase from 2014. This growth underscores Cisco's strategic prowess in networking solutions. Meanwhile, Super Micro's EBITDA, though smaller in scale, has surged by an impressive 1,385% from 2014 to 2024, reflecting its agility in the server and storage market.
As we look to the future, these trends offer a glimpse into the strategic directions of these tech titans.
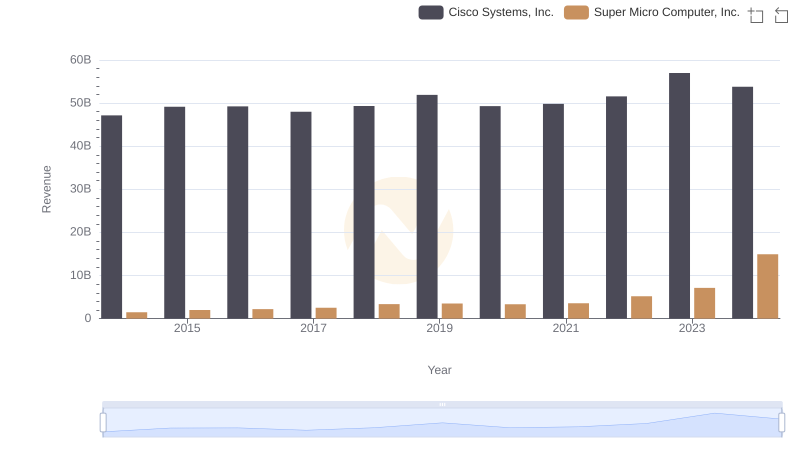
Cisco Systems, Inc. vs Super Micro Computer, Inc.: Examining Key Revenue Metrics
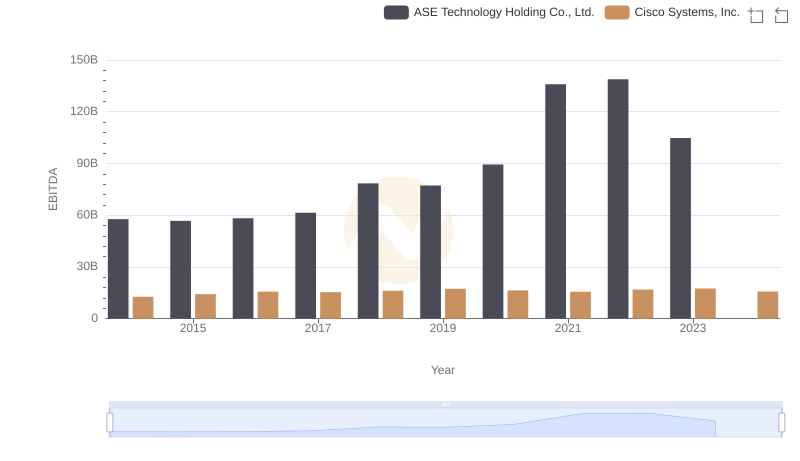
EBITDA Analysis: Evaluating Cisco Systems, Inc. Against ASE Technology Holding Co., Ltd.
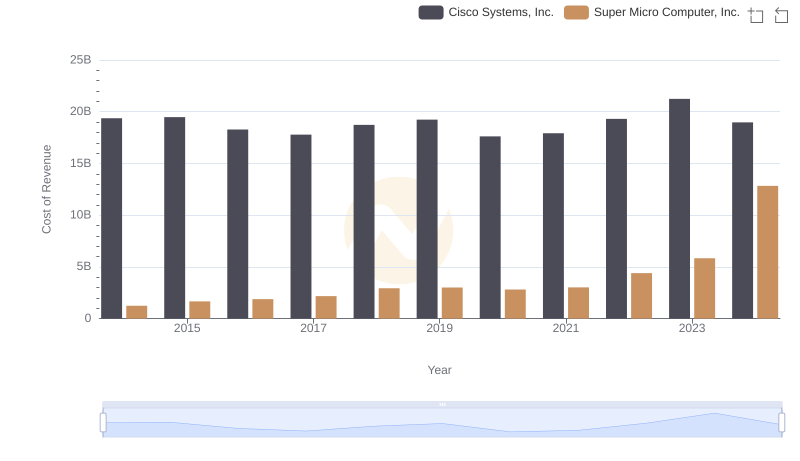
Cost of Revenue Comparison: Cisco Systems, Inc. vs Super Micro Computer, Inc.

Cisco Systems, Inc. vs Super Micro Computer, Inc.: A Gross Profit Performance Breakdown
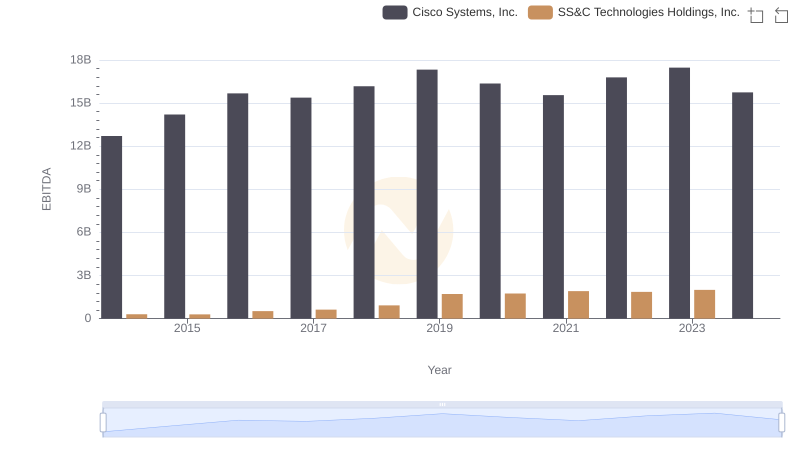
Cisco Systems, Inc. vs SS&C Technologies Holdings, Inc.: In-Depth EBITDA Performance Comparison
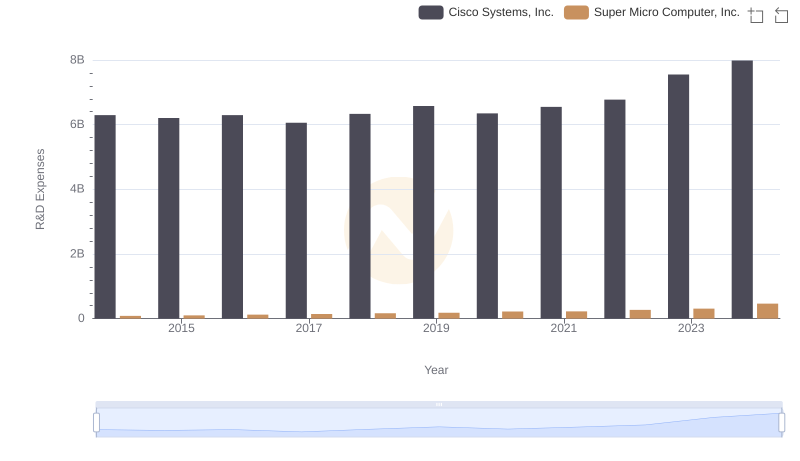
Research and Development Expenses Breakdown: Cisco Systems, Inc. vs Super Micro Computer, Inc.
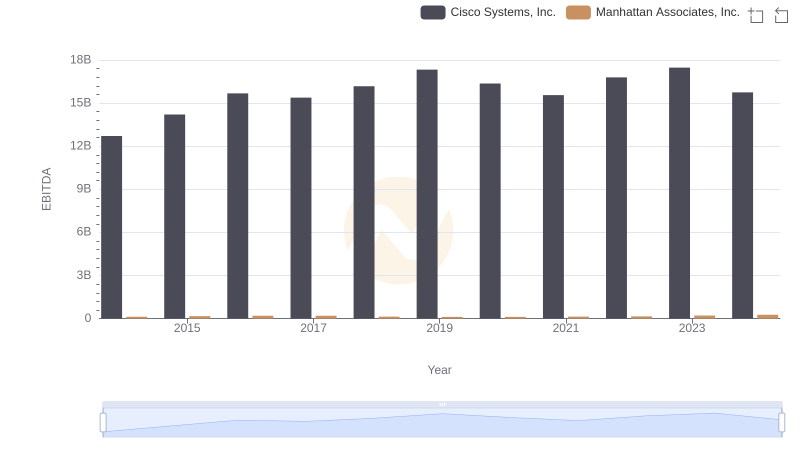
Cisco Systems, Inc. vs Manhattan Associates, Inc.: In-Depth EBITDA Performance Comparison
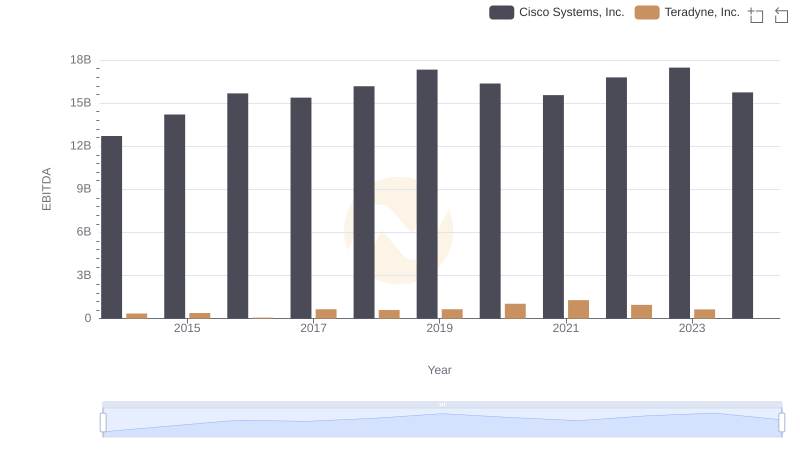
A Side-by-Side Analysis of EBITDA: Cisco Systems, Inc. and Teradyne, Inc.
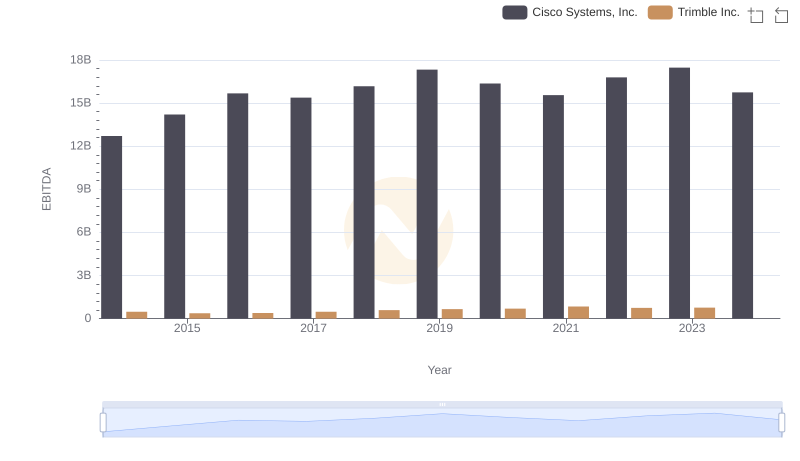
Comparative EBITDA Analysis: Cisco Systems, Inc. vs Trimble Inc.

Professional EBITDA Benchmarking: Cisco Systems, Inc. vs Gen Digital Inc.
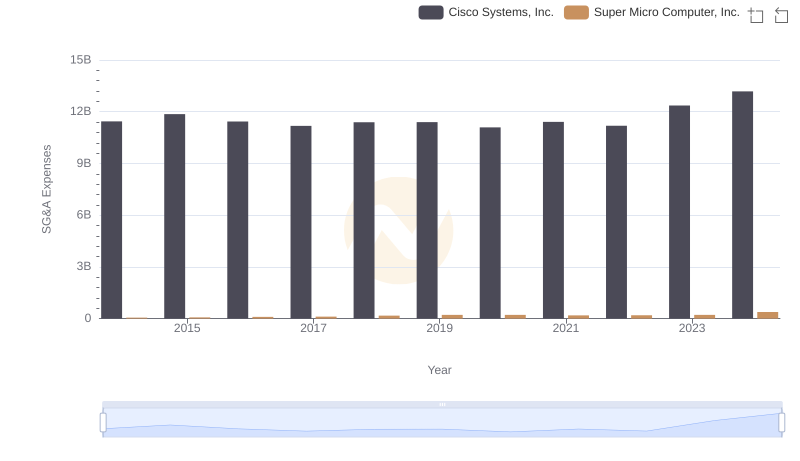
Cisco Systems, Inc. and Super Micro Computer, Inc.: SG&A Spending Patterns Compared
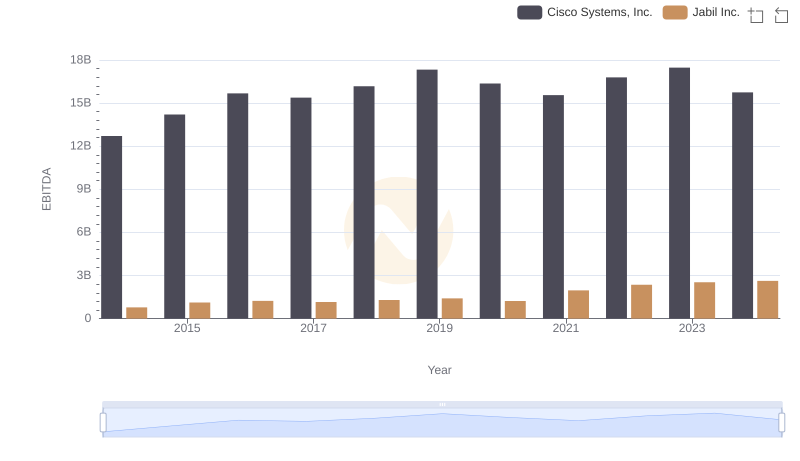
Professional EBITDA Benchmarking: Cisco Systems, Inc. vs Jabil Inc.