| __timestamp | Cisco Systems, Inc. | Gen Digital Inc. |
|---|---|---|
| Wednesday, January 1, 2014 | 19373000000 | 1149000000 |
| Thursday, January 1, 2015 | 19480000000 | 1153000000 |
| Friday, January 1, 2016 | 18287000000 | 615000000 |
| Sunday, January 1, 2017 | 17781000000 | 853000000 |
| Monday, January 1, 2018 | 18724000000 | 1032000000 |
| Tuesday, January 1, 2019 | 19238000000 | 1050000000 |
| Wednesday, January 1, 2020 | 17618000000 | 393000000 |
| Friday, January 1, 2021 | 17924000000 | 362000000 |
| Saturday, January 1, 2022 | 19309000000 | 408000000 |
| Sunday, January 1, 2023 | 21245000000 | 589000000 |
| Monday, January 1, 2024 | 18975000000 | 731000000 |
Unleashing the power of data
In the ever-evolving tech industry, cost efficiency is a critical metric for success. Over the past decade, Cisco Systems, Inc. and Gen Digital Inc. have demonstrated contrasting approaches to managing their cost of revenue. From 2014 to 2023, Cisco's cost of revenue has shown a steady trend, peaking in 2023 with a 10% increase from its 2014 figures. In contrast, Gen Digital's cost of revenue has fluctuated significantly, with a notable 68% decrease from 2015 to 2021, before a slight recovery in 2023.
This divergence highlights Cisco's consistent strategy in managing production costs, while Gen Digital's approach reflects a more volatile market adaptation. As we look to 2024, these trends offer valuable insights into each company's operational strategies and their impact on profitability. Understanding these dynamics is crucial for investors and industry analysts alike, as they navigate the complexities of the tech sector.
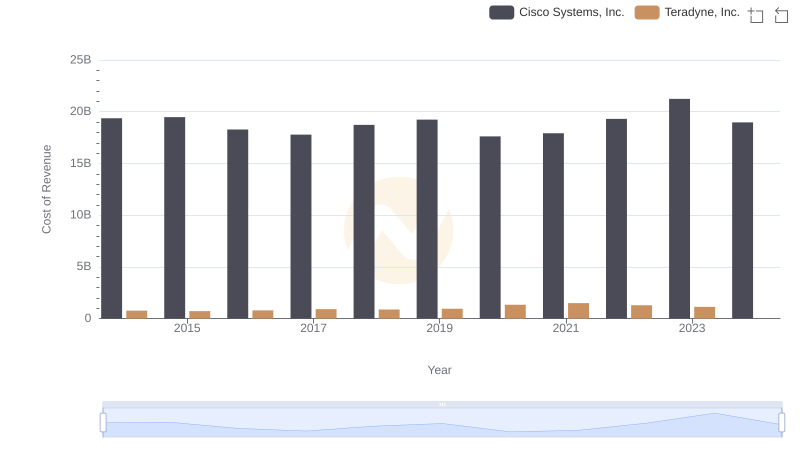
Cost of Revenue Comparison: Cisco Systems, Inc. vs Teradyne, Inc.
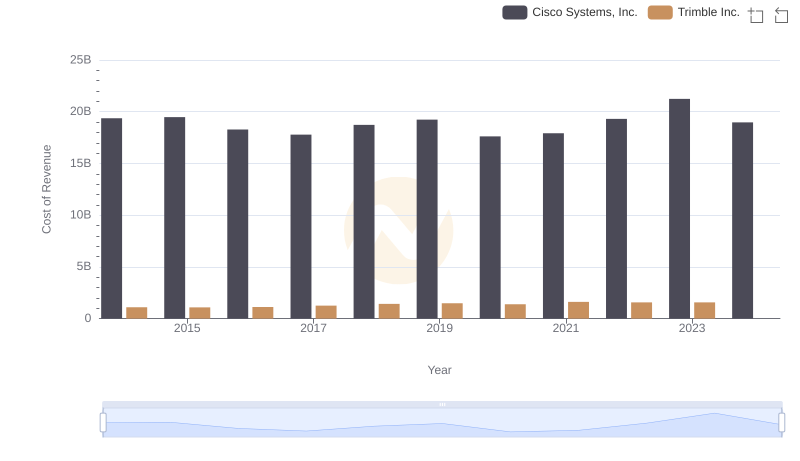
Cost Insights: Breaking Down Cisco Systems, Inc. and Trimble Inc.'s Expenses
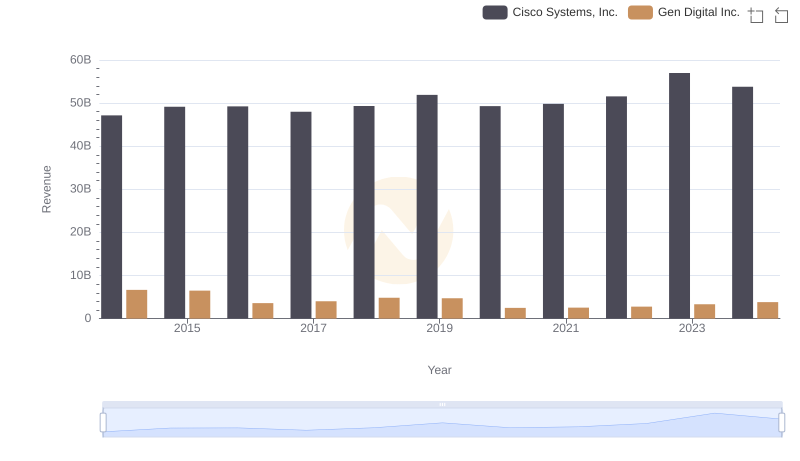
Breaking Down Revenue Trends: Cisco Systems, Inc. vs Gen Digital Inc.
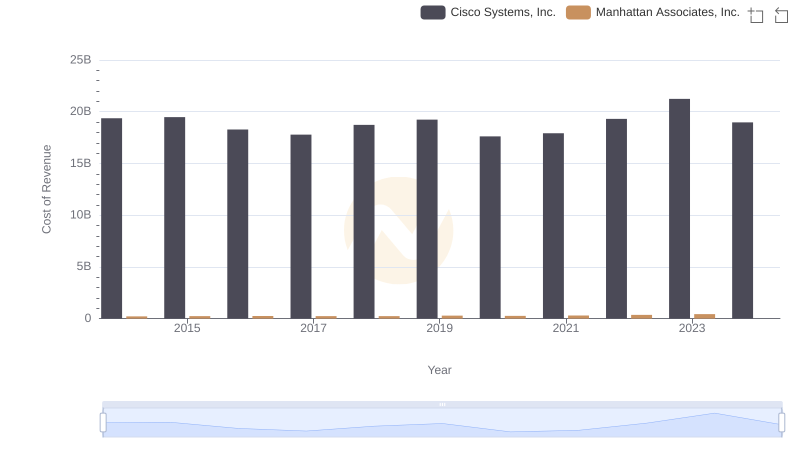
Cisco Systems, Inc. vs Manhattan Associates, Inc.: Efficiency in Cost of Revenue Explored
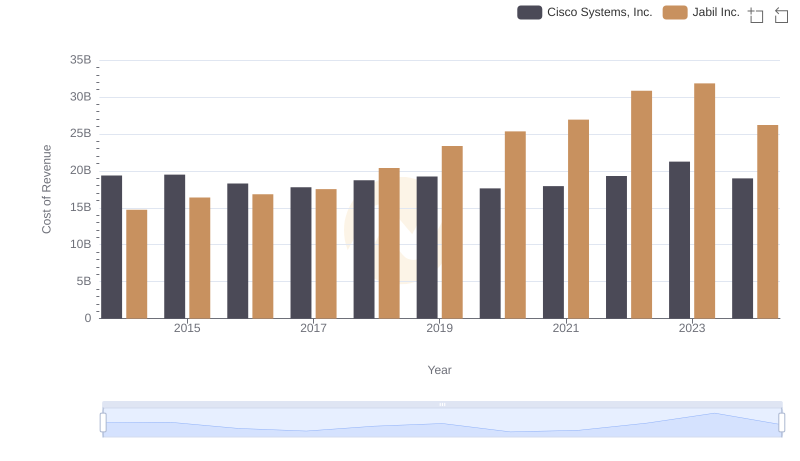
Analyzing Cost of Revenue: Cisco Systems, Inc. and Jabil Inc.
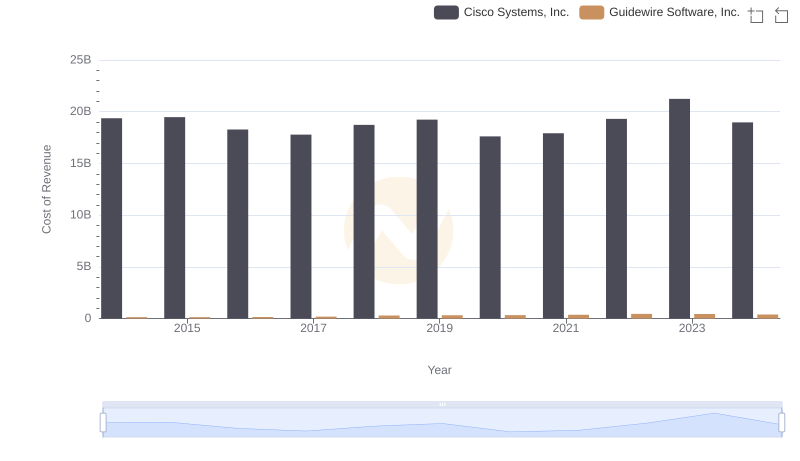
Cost of Revenue Trends: Cisco Systems, Inc. vs Guidewire Software, Inc.
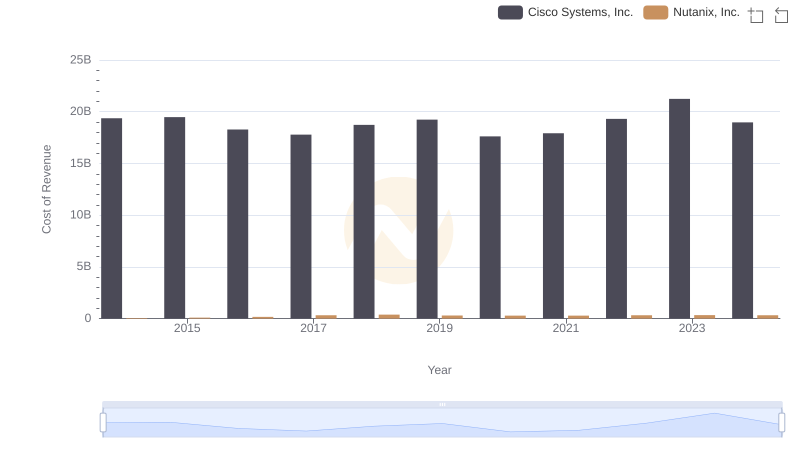
Cost Insights: Breaking Down Cisco Systems, Inc. and Nutanix, Inc.'s Expenses
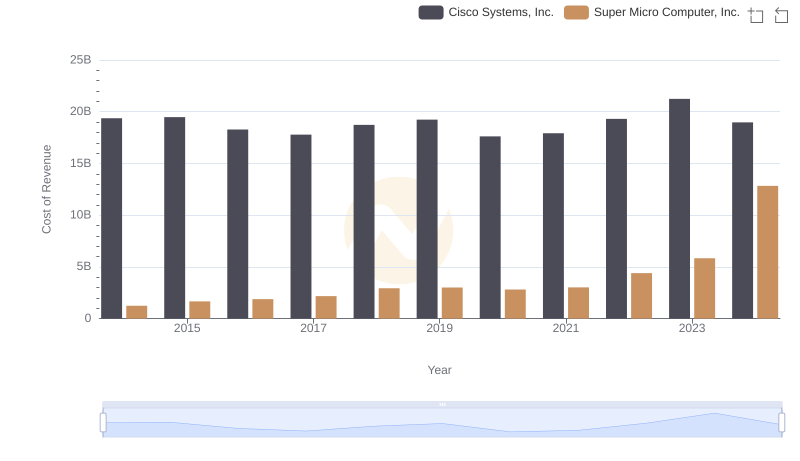
Cost of Revenue Comparison: Cisco Systems, Inc. vs Super Micro Computer, Inc.
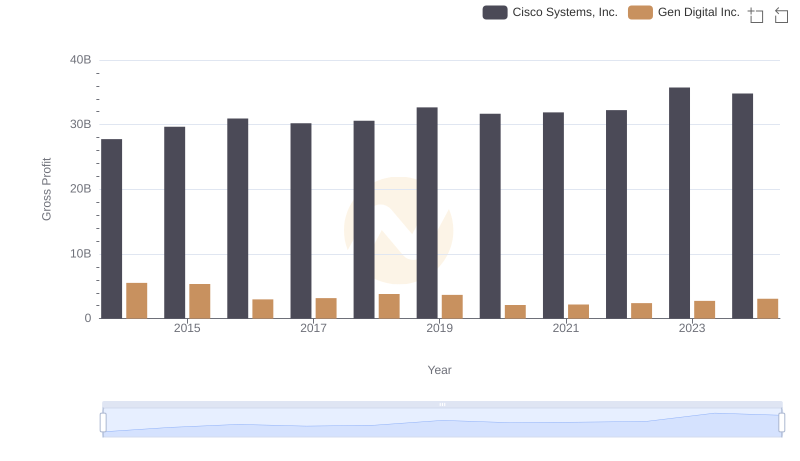
Gross Profit Trends Compared: Cisco Systems, Inc. vs Gen Digital Inc.
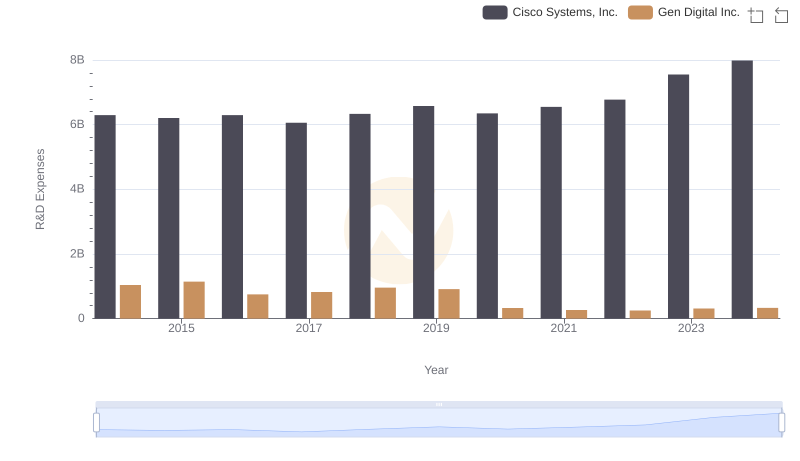
R&D Spending Showdown: Cisco Systems, Inc. vs Gen Digital Inc.
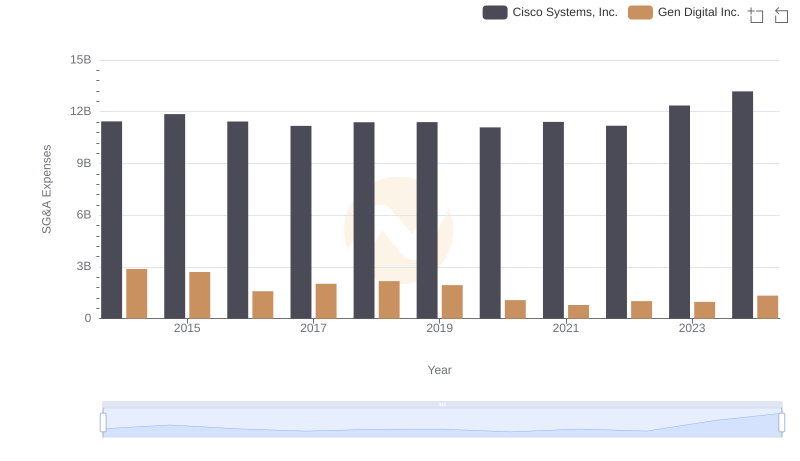
SG&A Efficiency Analysis: Comparing Cisco Systems, Inc. and Gen Digital Inc.

Professional EBITDA Benchmarking: Cisco Systems, Inc. vs Gen Digital Inc.