| __timestamp | Cisco Systems, Inc. | Teradyne, Inc. |
|---|---|---|
| Wednesday, January 1, 2014 | 19373000000 | 769016000 |
| Thursday, January 1, 2015 | 19480000000 | 723935000 |
| Friday, January 1, 2016 | 18287000000 | 793683000 |
| Sunday, January 1, 2017 | 17781000000 | 912734000 |
| Monday, January 1, 2018 | 18724000000 | 880408000 |
| Tuesday, January 1, 2019 | 19238000000 | 955136000 |
| Wednesday, January 1, 2020 | 17618000000 | 1335728000 |
| Friday, January 1, 2021 | 17924000000 | 1496225000 |
| Saturday, January 1, 2022 | 19309000000 | 1287894000 |
| Sunday, January 1, 2023 | 21245000000 | 1139550000 |
| Monday, January 1, 2024 | 18975000000 | 1170953000 |
Cracking the code
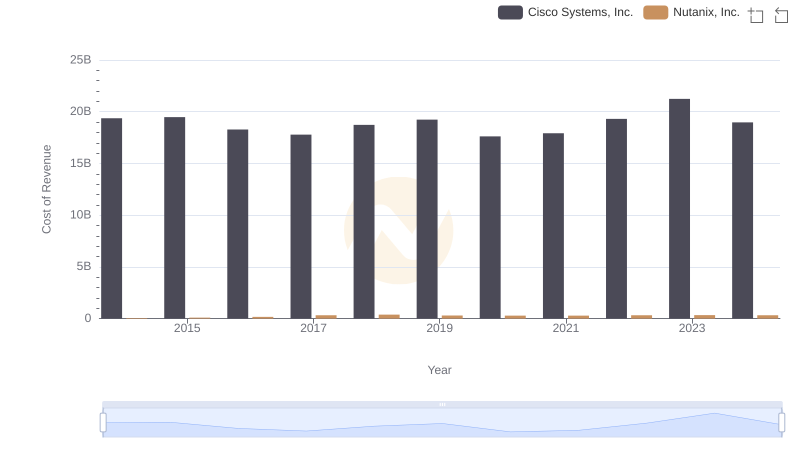
In the ever-evolving tech landscape, Cisco Systems, Inc. and Teradyne, Inc. have been pivotal players. From 2014 to 2023, Cisco's cost of revenue has shown a steady trend, peaking in 2023 with a 10% increase from its 2014 figures. This reflects Cisco's strategic investments in infrastructure and innovation. Meanwhile, Teradyne's cost of revenue, though significantly lower, has seen a remarkable 48% rise from 2014 to 2021, highlighting its growing influence in the semiconductor testing market.
Interestingly, 2020 marked a pivotal year for both companies. Cisco's cost of revenue dipped to its lowest, while Teradyne experienced a surge, possibly due to the global shift towards digital solutions. However, data for Teradyne in 2024 remains elusive, leaving room for speculation on its future trajectory. This comparison underscores the dynamic nature of the tech industry and the strategic maneuvers of its key players.
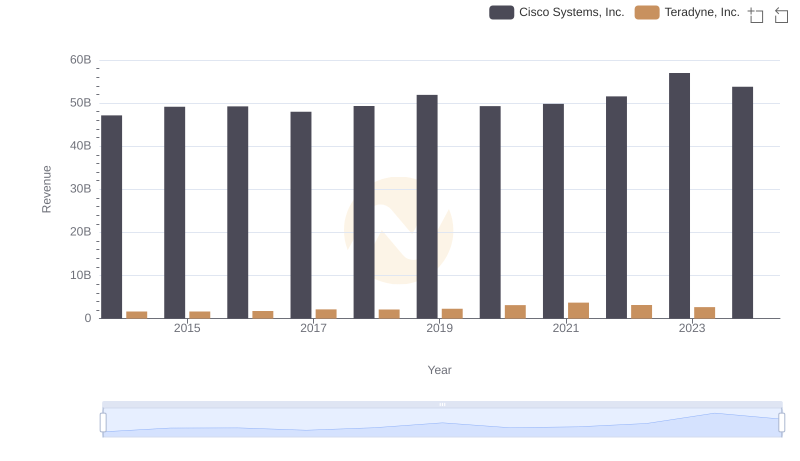
Who Generates More Revenue? Cisco Systems, Inc. or Teradyne, Inc.
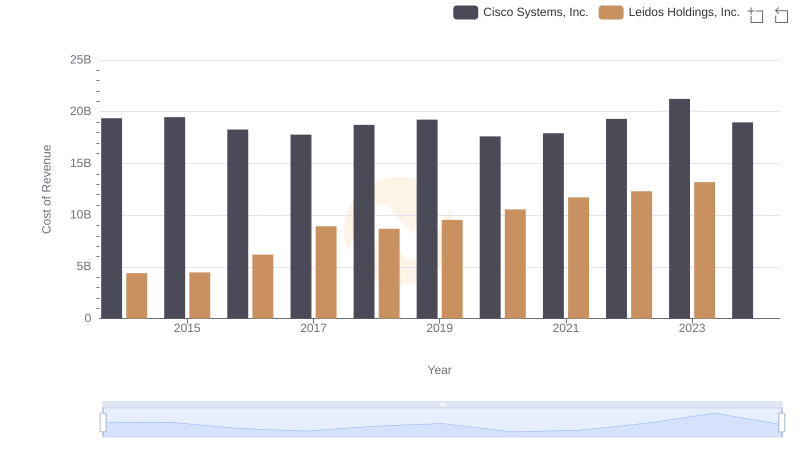
Analyzing Cost of Revenue: Cisco Systems, Inc. and Leidos Holdings, Inc.
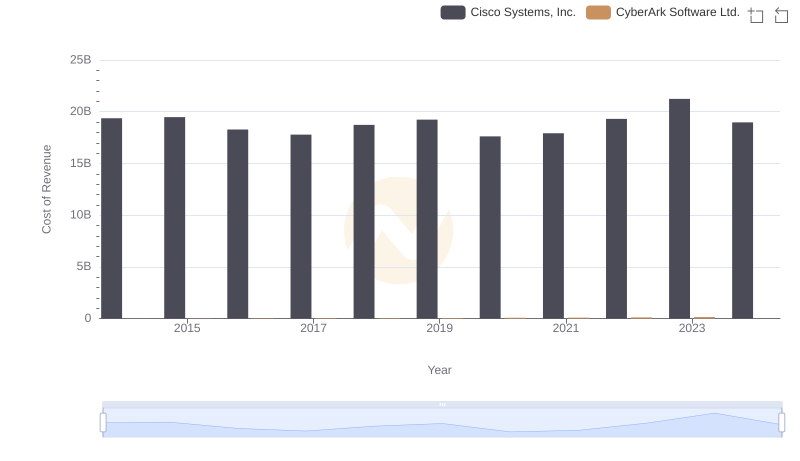
Cisco Systems, Inc. vs CyberArk Software Ltd.: Efficiency in Cost of Revenue Explored
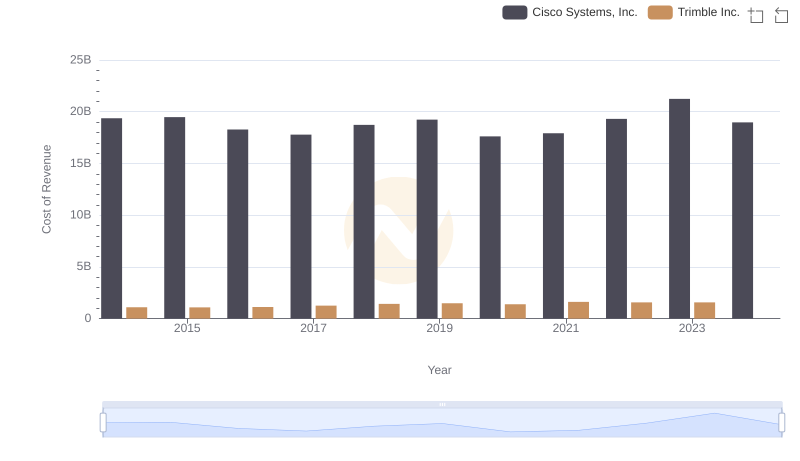
Cost Insights: Breaking Down Cisco Systems, Inc. and Trimble Inc.'s Expenses
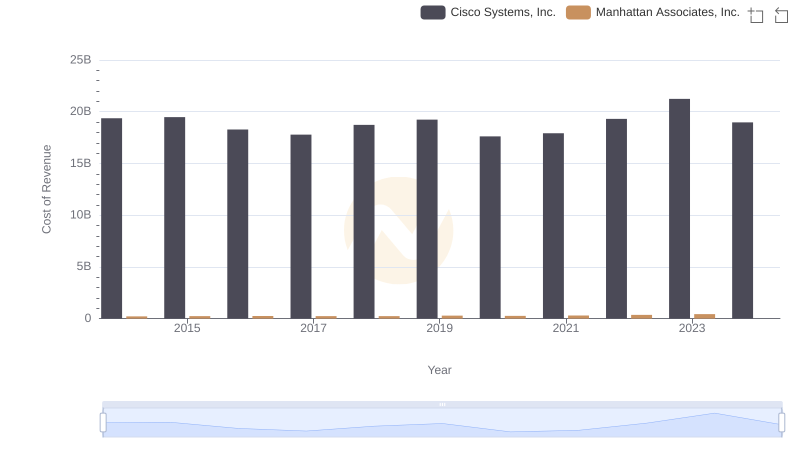
Cisco Systems, Inc. vs Manhattan Associates, Inc.: Efficiency in Cost of Revenue Explored
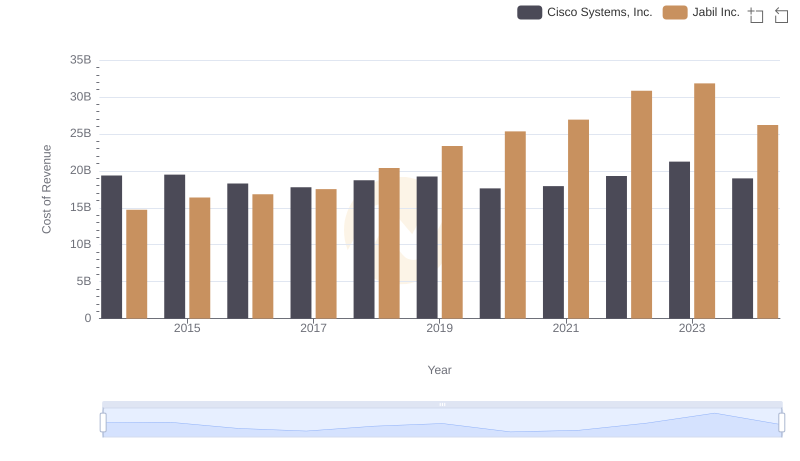
Analyzing Cost of Revenue: Cisco Systems, Inc. and Jabil Inc.
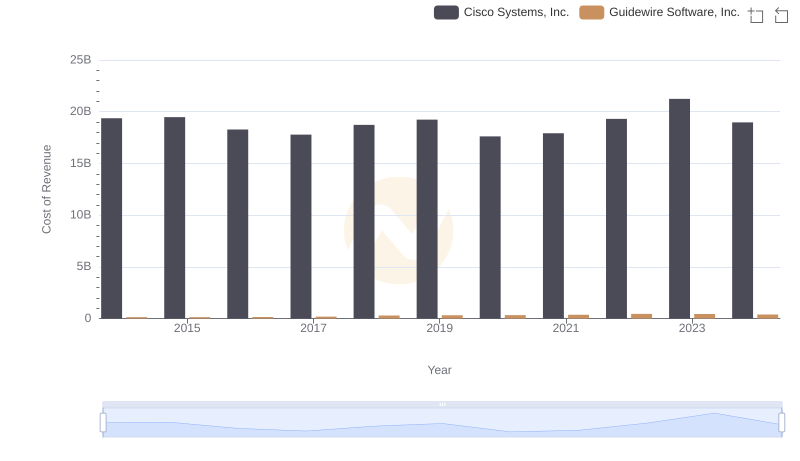
Cost of Revenue Trends: Cisco Systems, Inc. vs Guidewire Software, Inc.
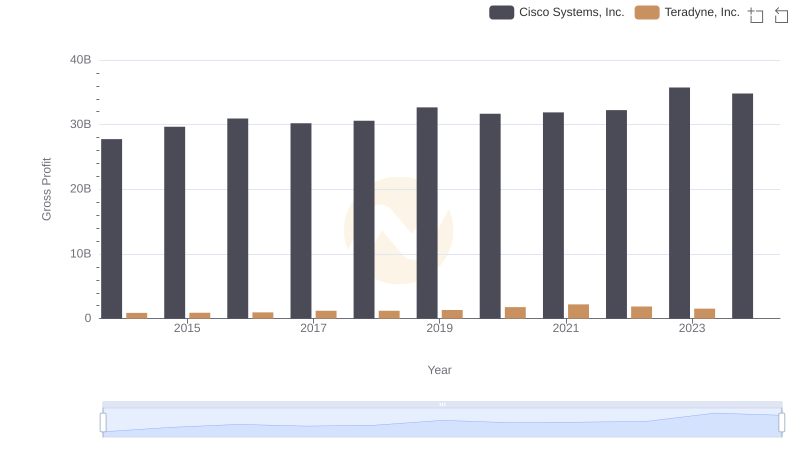
Gross Profit Comparison: Cisco Systems, Inc. and Teradyne, Inc. Trends
Cost Insights: Breaking Down Cisco Systems, Inc. and Nutanix, Inc.'s Expenses
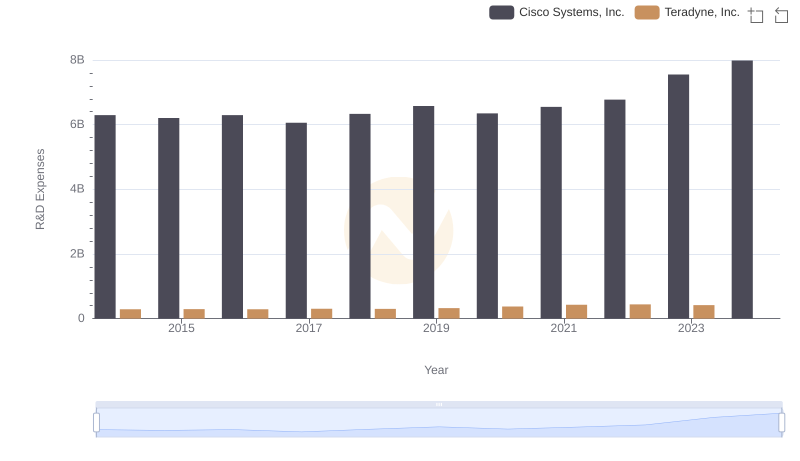
Research and Development Expenses Breakdown: Cisco Systems, Inc. vs Teradyne, Inc.
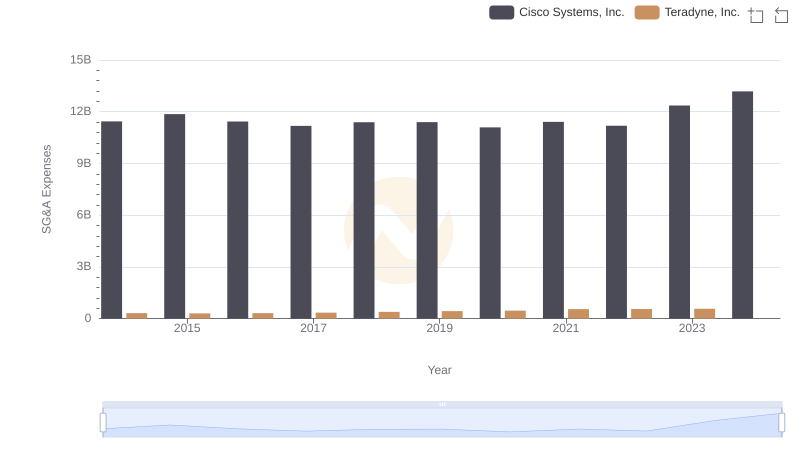
Cisco Systems, Inc. or Teradyne, Inc.: Who Manages SG&A Costs Better?
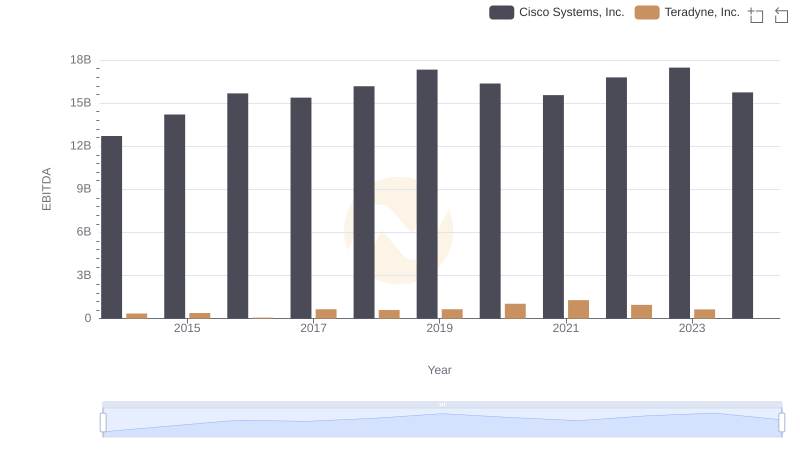
A Side-by-Side Analysis of EBITDA: Cisco Systems, Inc. and Teradyne, Inc.