| __timestamp | Cisco Systems, Inc. | Jabil Inc. |
|---|---|---|
| Wednesday, January 1, 2014 | 19373000000 | 14736543000 |
| Thursday, January 1, 2015 | 19480000000 | 16395978000 |
| Friday, January 1, 2016 | 18287000000 | 16825382000 |
| Sunday, January 1, 2017 | 17781000000 | 17517478000 |
| Monday, January 1, 2018 | 18724000000 | 20388624000 |
| Tuesday, January 1, 2019 | 19238000000 | 23368919000 |
| Wednesday, January 1, 2020 | 17618000000 | 25335625000 |
| Friday, January 1, 2021 | 17924000000 | 26926000000 |
| Saturday, January 1, 2022 | 19309000000 | 30846000000 |
| Sunday, January 1, 2023 | 21245000000 | 31835000000 |
| Monday, January 1, 2024 | 18975000000 | 26207000000 |
Unlocking the unknown
In the ever-evolving tech landscape, understanding cost structures is crucial. From 2014 to 2024, Cisco Systems, Inc. and Jabil Inc. have showcased distinct trends in their cost of revenue. Cisco's cost of revenue has remained relatively stable, with a slight dip in 2020, reflecting a 9% decrease from 2019, likely due to global disruptions. However, by 2023, Cisco rebounded with a 21% increase, reaching its peak. In contrast, Jabil Inc. experienced a more dynamic trajectory, with a notable 108% surge from 2014 to 2023, peaking in 2023. This growth underscores Jabil's aggressive expansion and adaptation strategies. The data highlights the resilience and strategic pivots of these giants in the face of economic challenges. As we move forward, these insights offer a glimpse into the financial health and strategic priorities of two leading industry players.
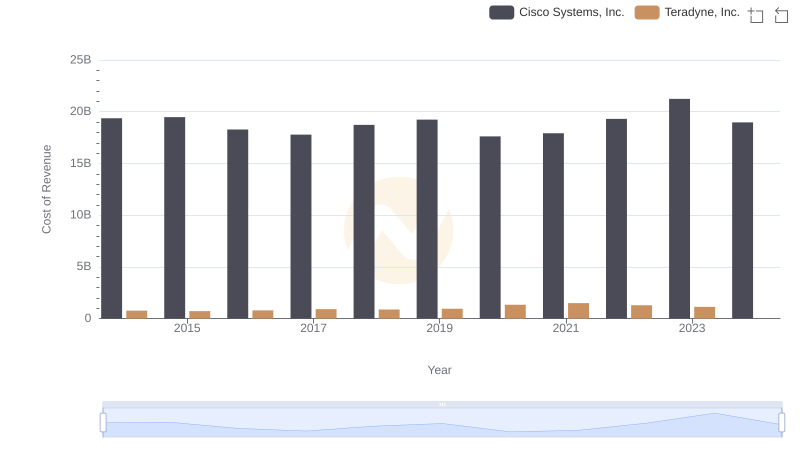
Cost of Revenue Comparison: Cisco Systems, Inc. vs Teradyne, Inc.
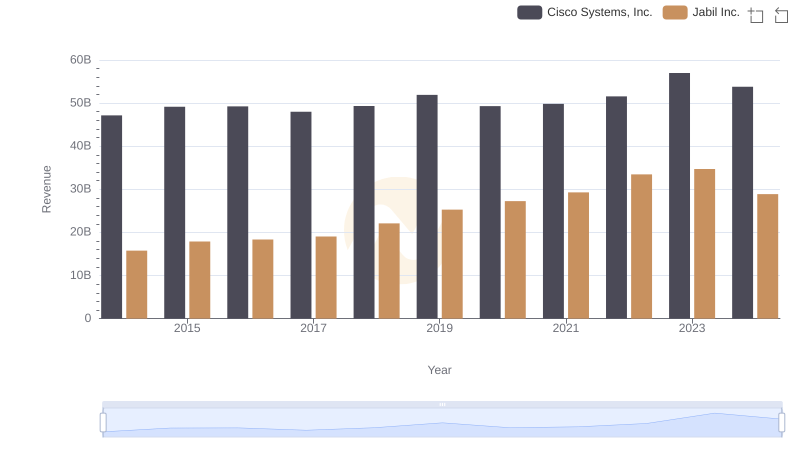
Revenue Insights: Cisco Systems, Inc. and Jabil Inc. Performance Compared
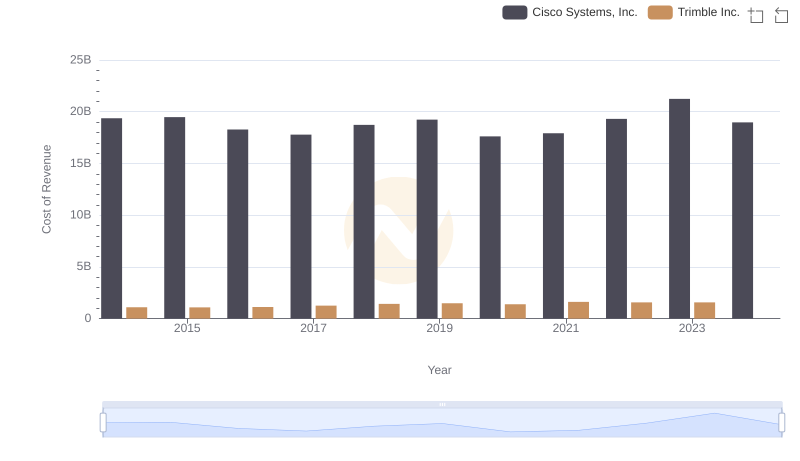
Cost Insights: Breaking Down Cisco Systems, Inc. and Trimble Inc.'s Expenses
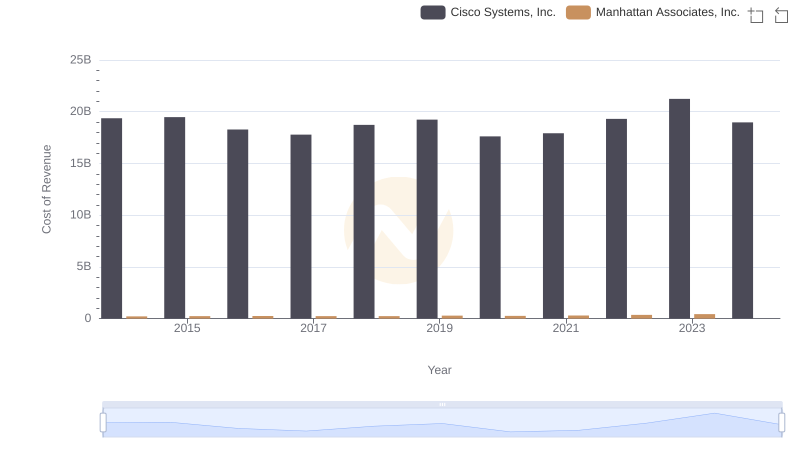
Cisco Systems, Inc. vs Manhattan Associates, Inc.: Efficiency in Cost of Revenue Explored
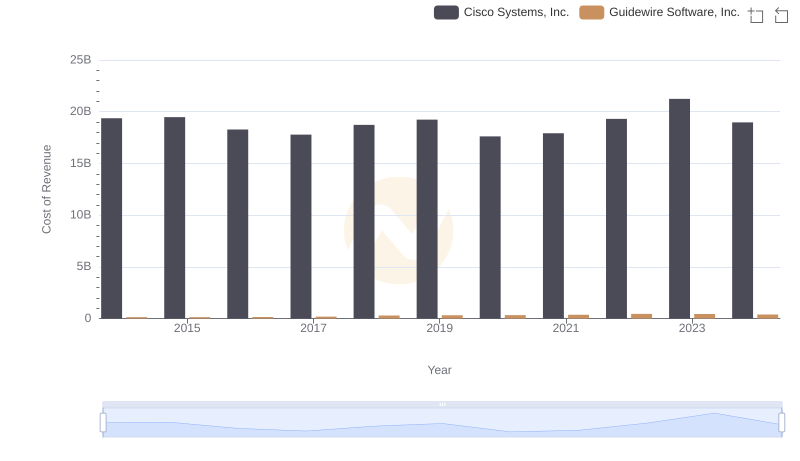
Cost of Revenue Trends: Cisco Systems, Inc. vs Guidewire Software, Inc.
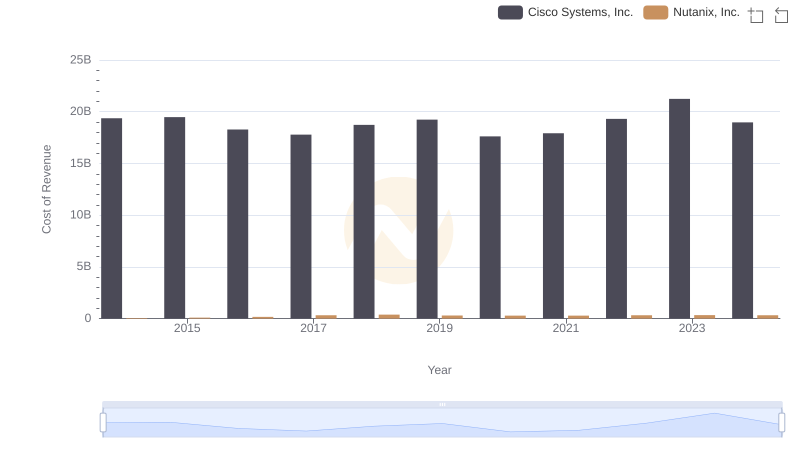
Cost Insights: Breaking Down Cisco Systems, Inc. and Nutanix, Inc.'s Expenses
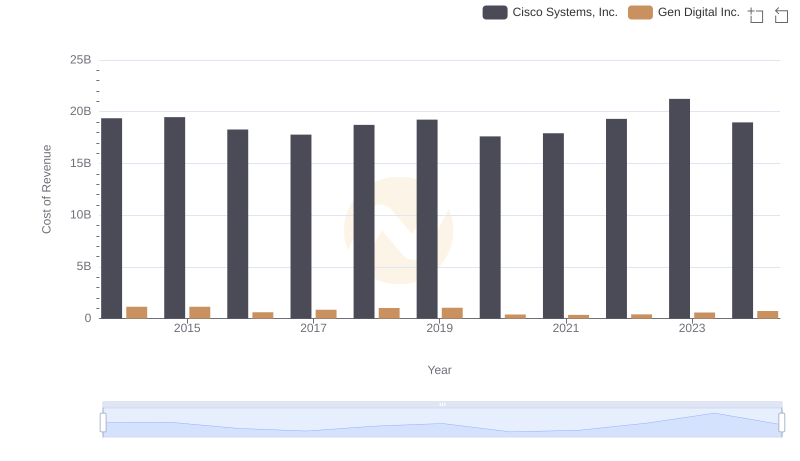
Comparing Cost of Revenue Efficiency: Cisco Systems, Inc. vs Gen Digital Inc.
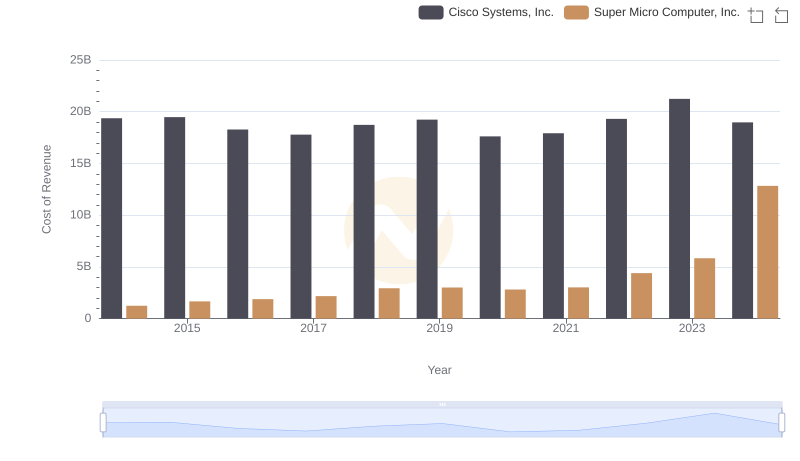
Cost of Revenue Comparison: Cisco Systems, Inc. vs Super Micro Computer, Inc.
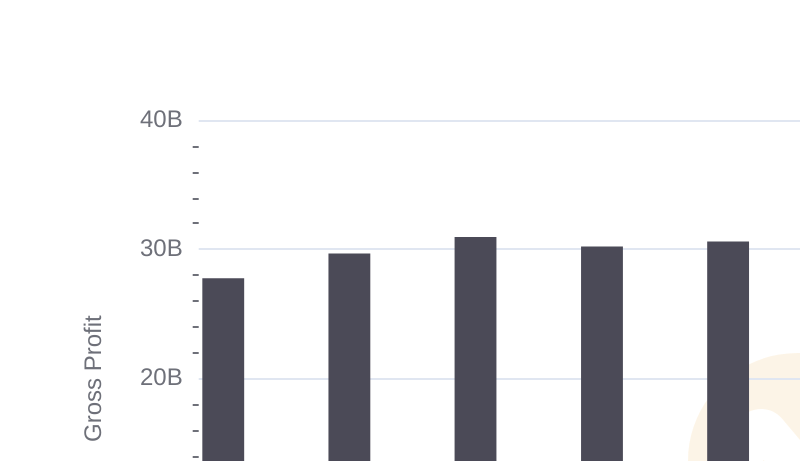
Cisco Systems, Inc. and Jabil Inc.: A Detailed Gross Profit Analysis
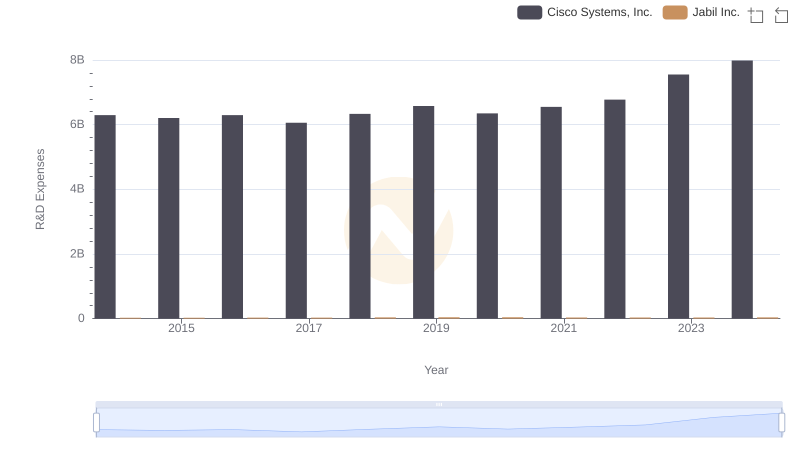
R&D Insights: How Cisco Systems, Inc. and Jabil Inc. Allocate Funds
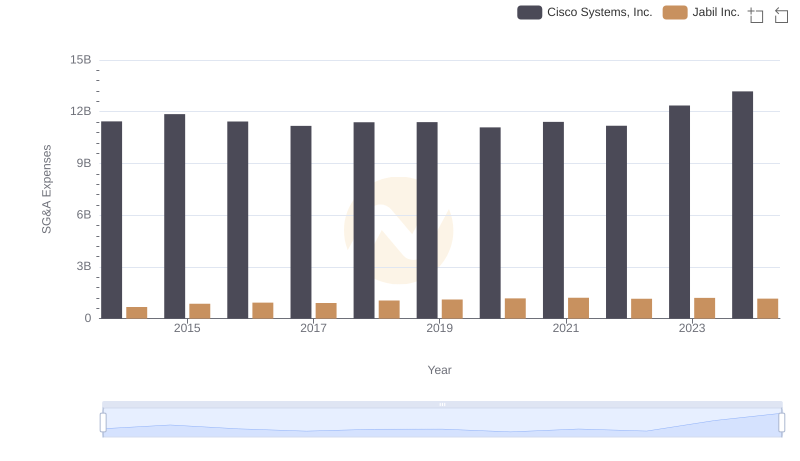
SG&A Efficiency Analysis: Comparing Cisco Systems, Inc. and Jabil Inc.
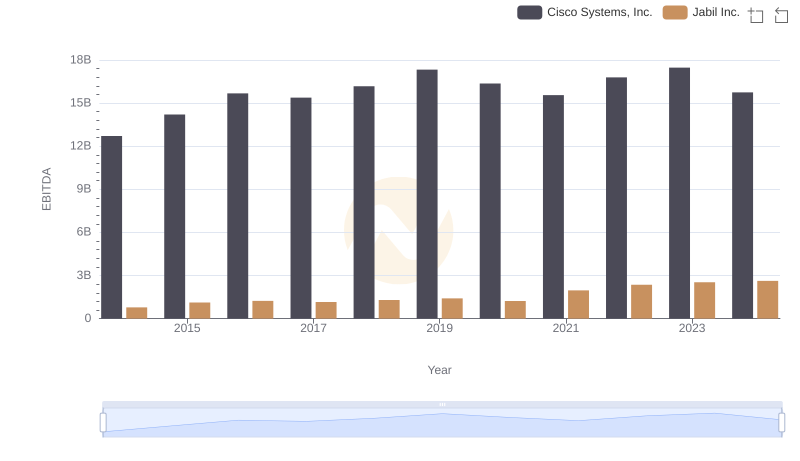
Professional EBITDA Benchmarking: Cisco Systems, Inc. vs Jabil Inc.