| __timestamp | Cisco Systems, Inc. | Trimble Inc. |
|---|---|---|
| Wednesday, January 1, 2014 | 19373000000 | 1104702000 |
| Thursday, January 1, 2015 | 19480000000 | 1088200000 |
| Friday, January 1, 2016 | 18287000000 | 1124200000 |
| Sunday, January 1, 2017 | 17781000000 | 1261600000 |
| Monday, January 1, 2018 | 18724000000 | 1427400000 |
| Tuesday, January 1, 2019 | 19238000000 | 1483400000 |
| Wednesday, January 1, 2020 | 17618000000 | 1392800000 |
| Friday, January 1, 2021 | 17924000000 | 1624400000 |
| Saturday, January 1, 2022 | 19309000000 | 1570700000 |
| Sunday, January 1, 2023 | 21245000000 | 1569500000 |
| Monday, January 1, 2024 | 18975000000 |
Infusing magic into the data realm
In the ever-evolving tech landscape, understanding cost structures is crucial for investors and analysts alike. Cisco Systems, Inc. and Trimble Inc., two giants in their respective fields, offer a fascinating study in cost management over the past decade. From 2014 to 2023, Cisco's cost of revenue has shown a slight decline, averaging around $18.9 billion annually, with a notable peak in 2023 at approximately $21.2 billion. This represents a 10% increase from its lowest point in 2020. Meanwhile, Trimble Inc. has maintained a more stable cost structure, with an average cost of revenue of $1.36 billion, peaking in 2021 at $1.62 billion, a 49% increase from its 2015 low. The data for 2024 is incomplete, highlighting the dynamic nature of financial forecasting. These insights underscore the importance of strategic cost management in maintaining competitive advantage in the tech industry.

Revenue Insights: Cisco Systems, Inc. and Trimble Inc. Performance Compared
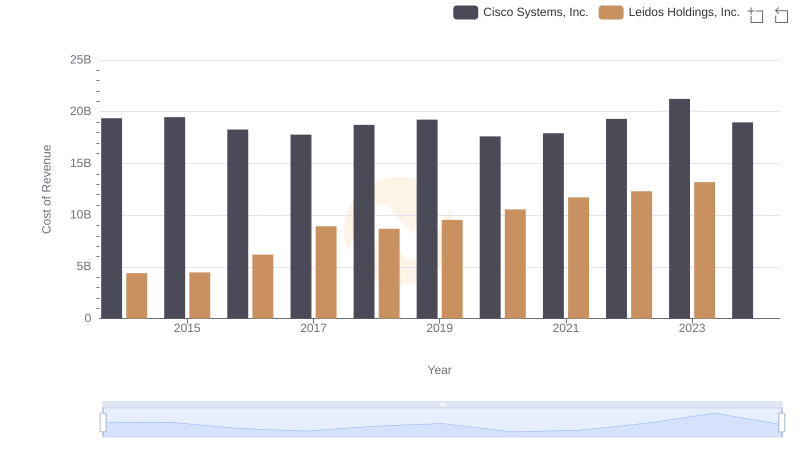
Analyzing Cost of Revenue: Cisco Systems, Inc. and Leidos Holdings, Inc.
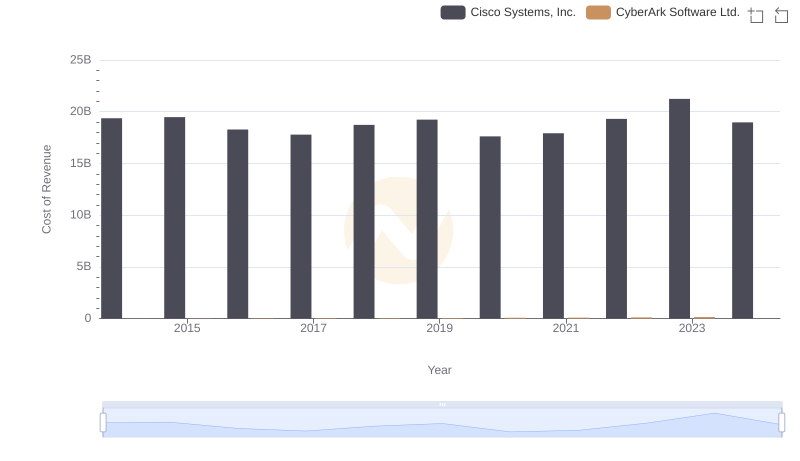
Cisco Systems, Inc. vs CyberArk Software Ltd.: Efficiency in Cost of Revenue Explored
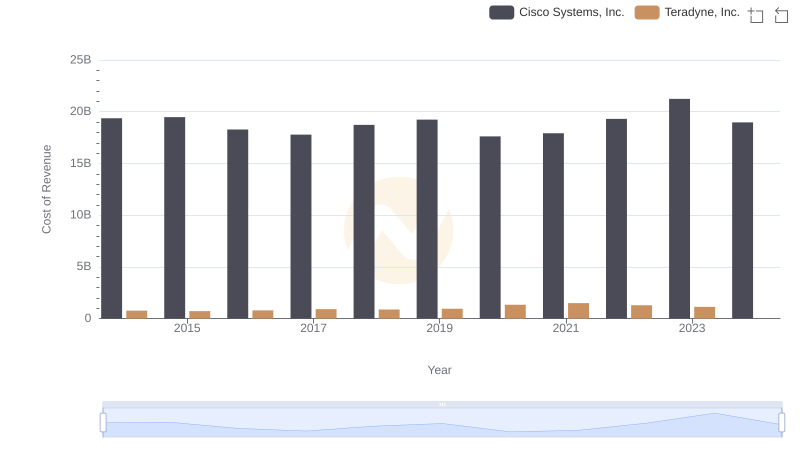
Cost of Revenue Comparison: Cisco Systems, Inc. vs Teradyne, Inc.
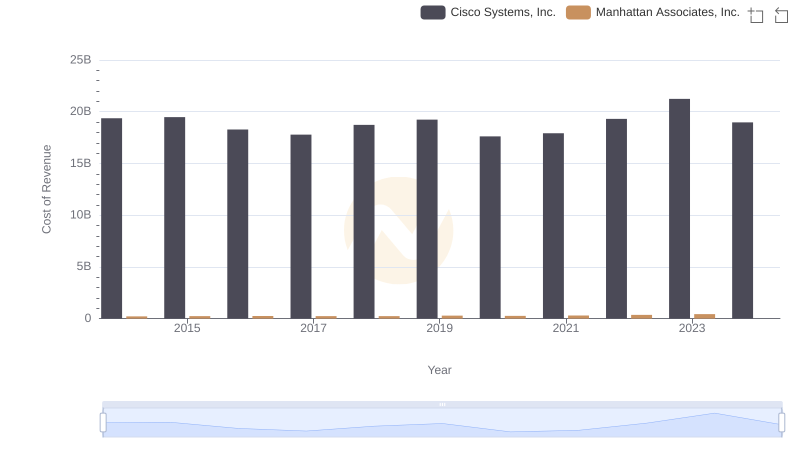
Cisco Systems, Inc. vs Manhattan Associates, Inc.: Efficiency in Cost of Revenue Explored
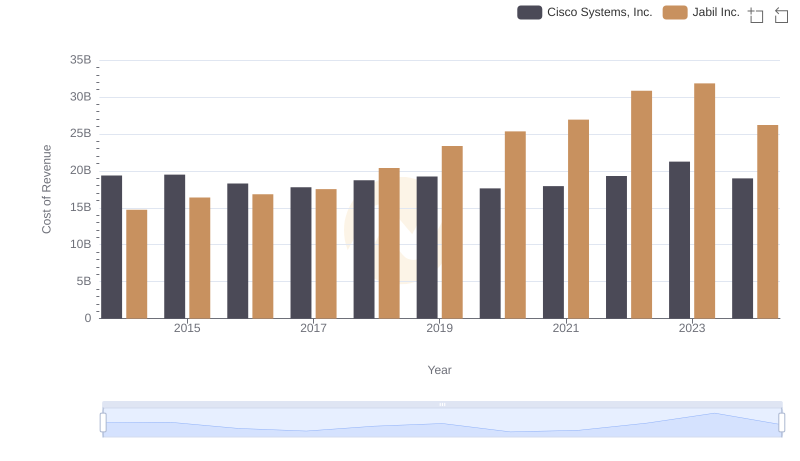
Analyzing Cost of Revenue: Cisco Systems, Inc. and Jabil Inc.
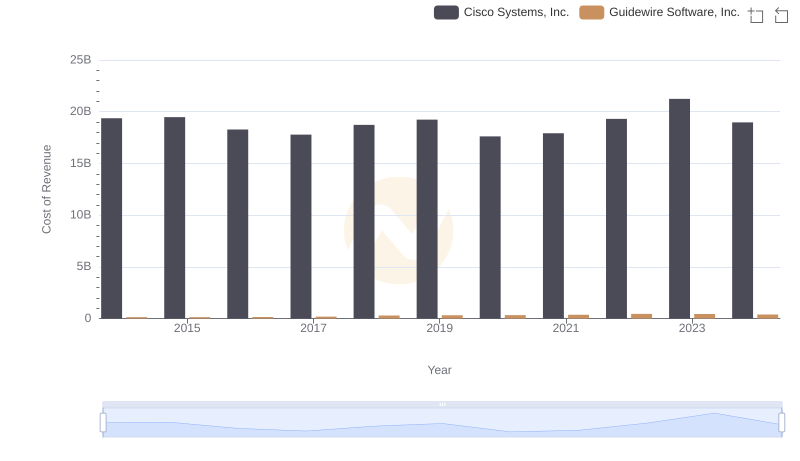
Cost of Revenue Trends: Cisco Systems, Inc. vs Guidewire Software, Inc.
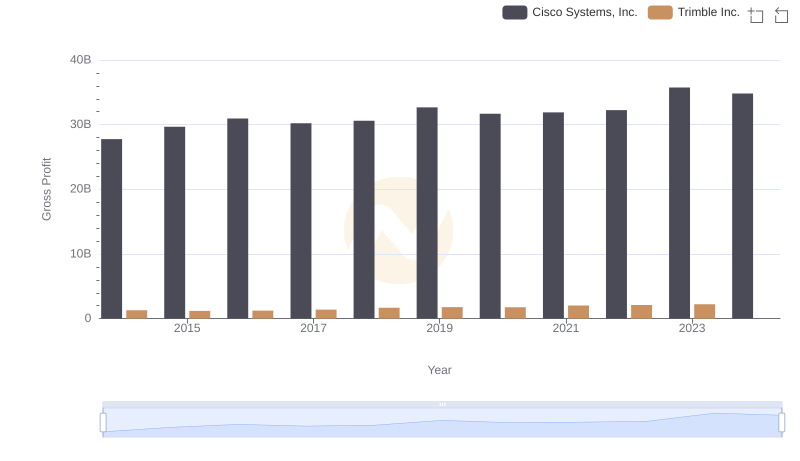
Key Insights on Gross Profit: Cisco Systems, Inc. vs Trimble Inc.
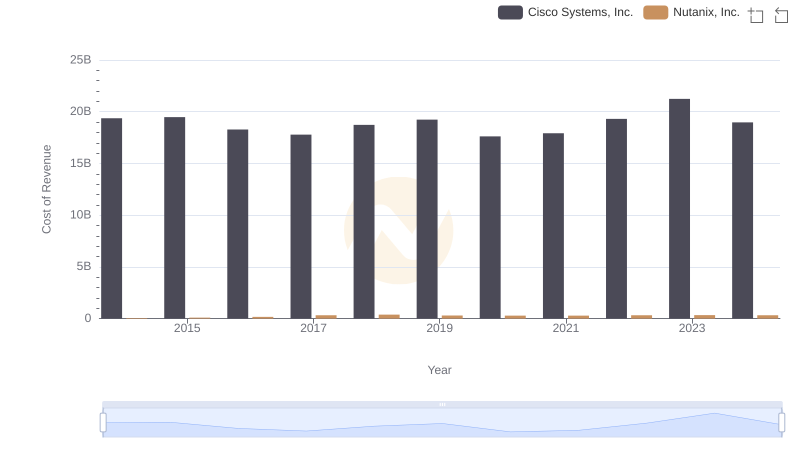
Cost Insights: Breaking Down Cisco Systems, Inc. and Nutanix, Inc.'s Expenses
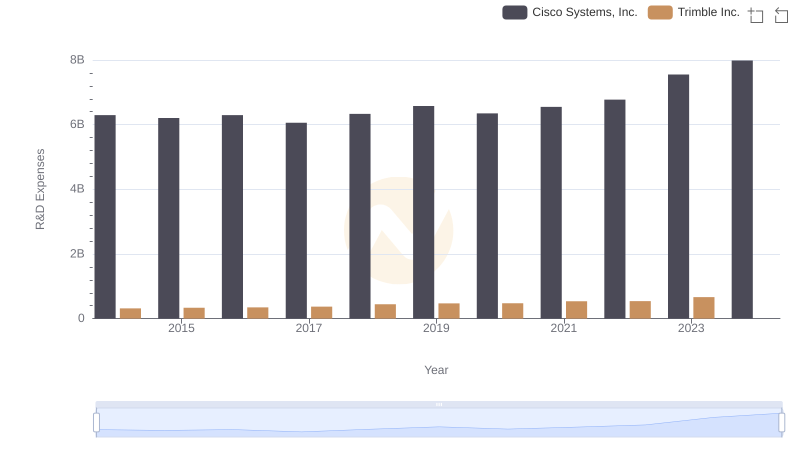
Who Prioritizes Innovation? R&D Spending Compared for Cisco Systems, Inc. and Trimble Inc.
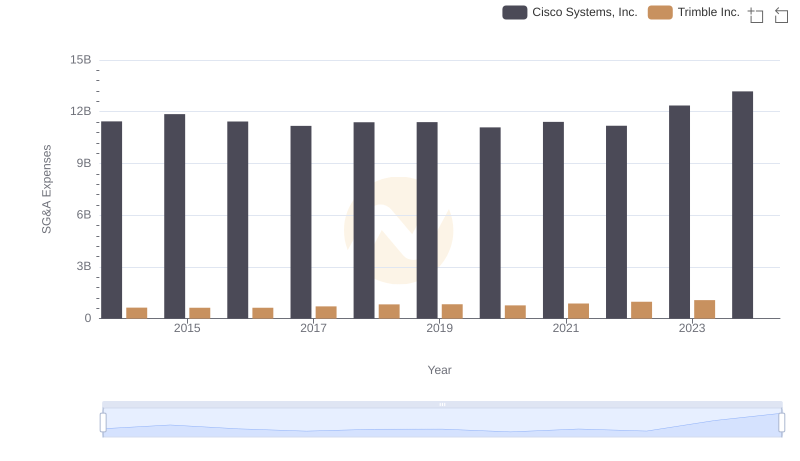
Cost Management Insights: SG&A Expenses for Cisco Systems, Inc. and Trimble Inc.
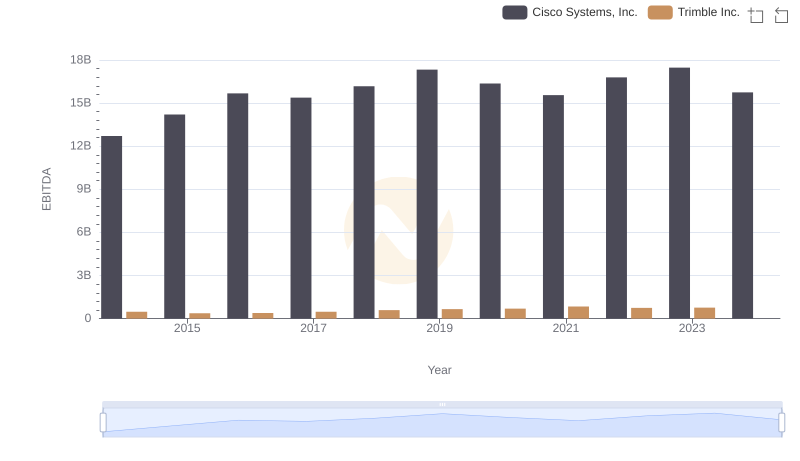
Comparative EBITDA Analysis: Cisco Systems, Inc. vs Trimble Inc.