| __timestamp | Cintas Corporation | XPO Logistics, Inc. |
|---|---|---|
| Wednesday, January 1, 2014 | 4551812000 | 2356600000 |
| Thursday, January 1, 2015 | 4476886000 | 7623200000 |
| Friday, January 1, 2016 | 4905458000 | 14619400000 |
| Sunday, January 1, 2017 | 5323381000 | 15380800000 |
| Monday, January 1, 2018 | 6476632000 | 17279000000 |
| Tuesday, January 1, 2019 | 6892303000 | 16648000000 |
| Wednesday, January 1, 2020 | 7085120000 | 16252000000 |
| Friday, January 1, 2021 | 7116340000 | 12806000000 |
| Saturday, January 1, 2022 | 7854459000 | 7718000000 |
| Sunday, January 1, 2023 | 8815769000 | 7744000000 |
| Monday, January 1, 2024 | 9596615000 | 8072000000 |
Igniting the spark of knowledge
In the ever-evolving landscape of corporate growth, Cintas Corporation and XPO Logistics, Inc. have showcased intriguing revenue trajectories over the past decade. From 2014 to 2023, Cintas Corporation's revenue surged by approximately 111%, reflecting a robust annual growth rate. In contrast, XPO Logistics, Inc. experienced a more volatile journey, peaking in 2018 with a revenue increase of over 630% from 2014, before witnessing a decline in subsequent years.
Cintas Corporation's steady climb, with revenues reaching nearly $9.6 billion in 2023, underscores its consistent market strategy and operational efficiency. Meanwhile, XPO Logistics, Inc., despite its initial rapid growth, faced challenges post-2018, with revenues dropping to around $7.7 billion by 2023. This divergence highlights the impact of strategic decisions and market conditions on corporate performance.
As we look to the future, the missing data for 2024 invites speculation on how these industry giants will adapt and thrive.
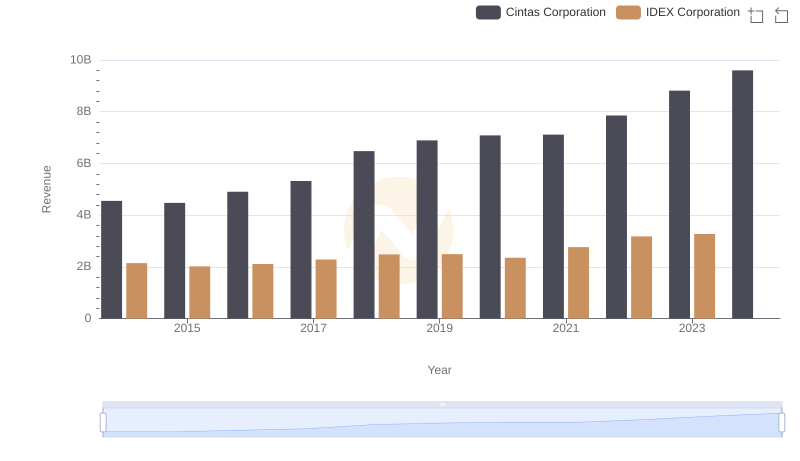
Comparing Revenue Performance: Cintas Corporation or IDEX Corporation?
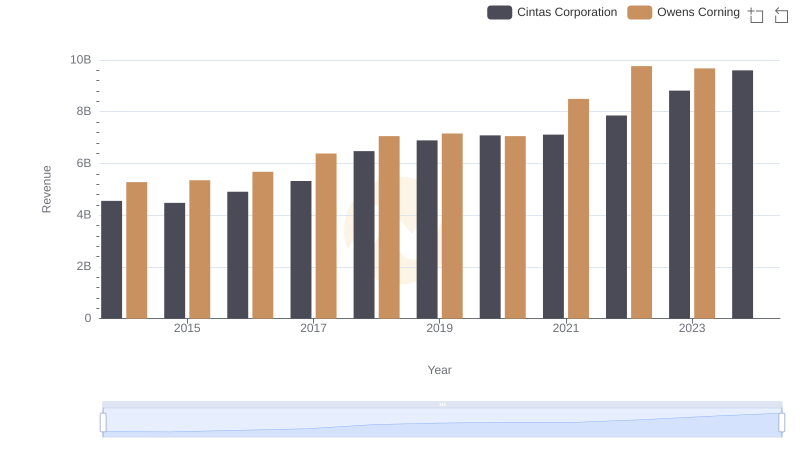
Cintas Corporation and Owens Corning: A Comprehensive Revenue Analysis
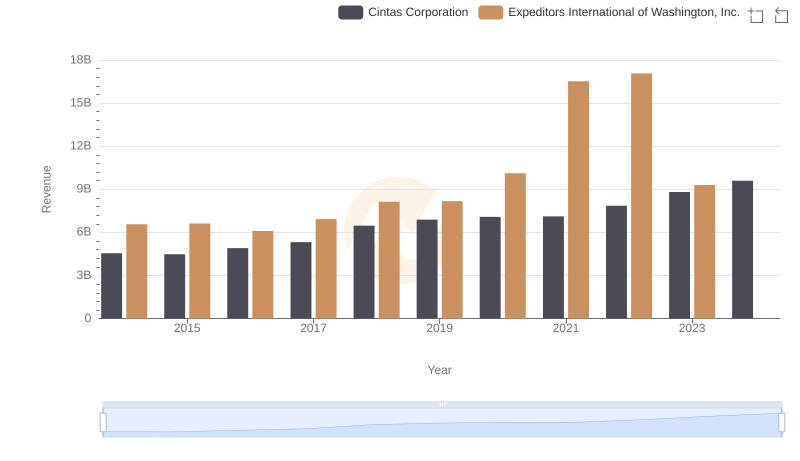
Cintas Corporation or Expeditors International of Washington, Inc.: Who Leads in Yearly Revenue?
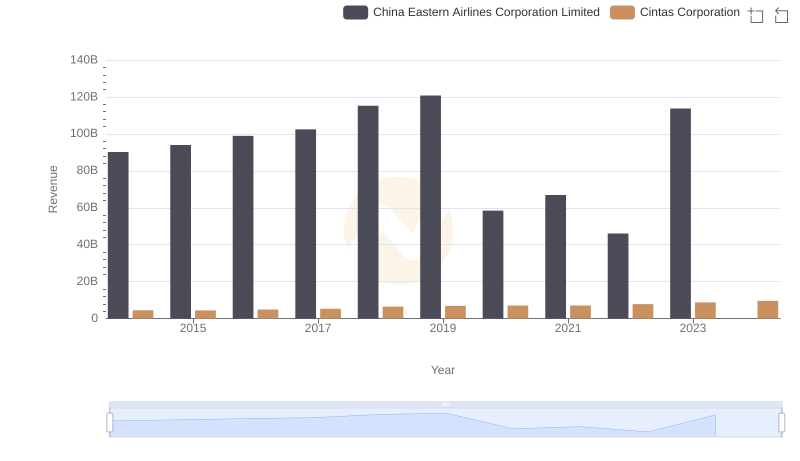
Annual Revenue Comparison: Cintas Corporation vs China Eastern Airlines Corporation Limited
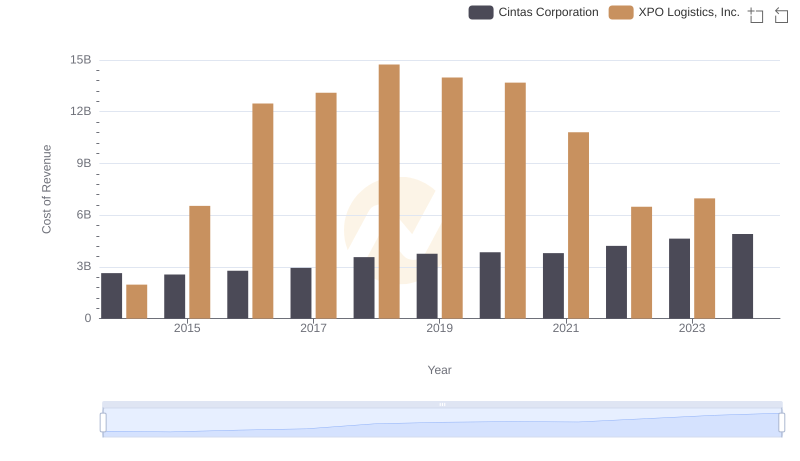
Cost of Revenue Comparison: Cintas Corporation vs XPO Logistics, Inc.
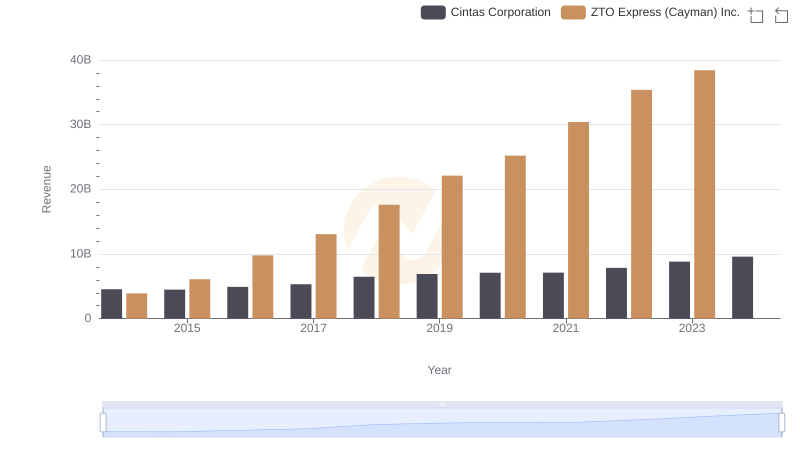
Annual Revenue Comparison: Cintas Corporation vs ZTO Express (Cayman) Inc.
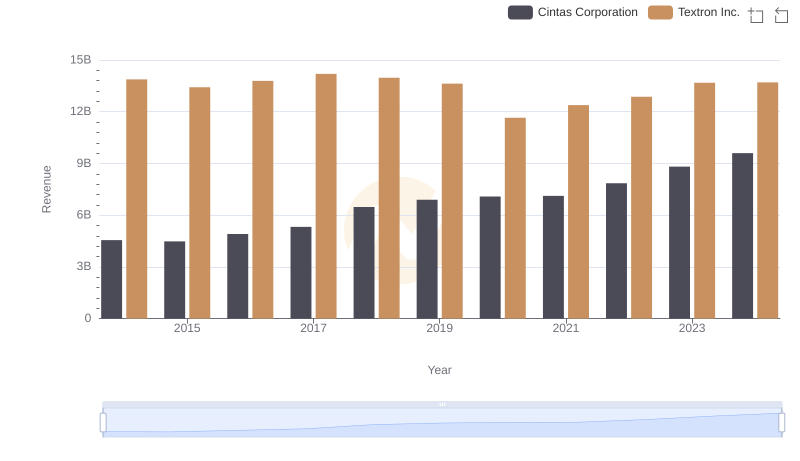
Cintas Corporation vs Textron Inc.: Annual Revenue Growth Compared
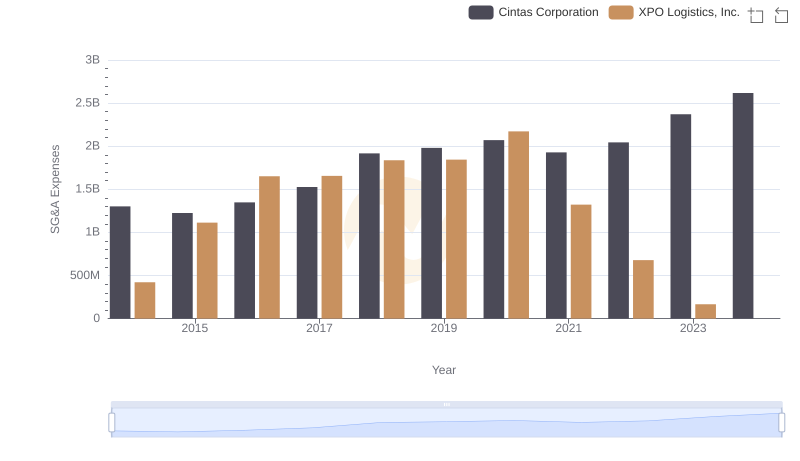
SG&A Efficiency Analysis: Comparing Cintas Corporation and XPO Logistics, Inc.
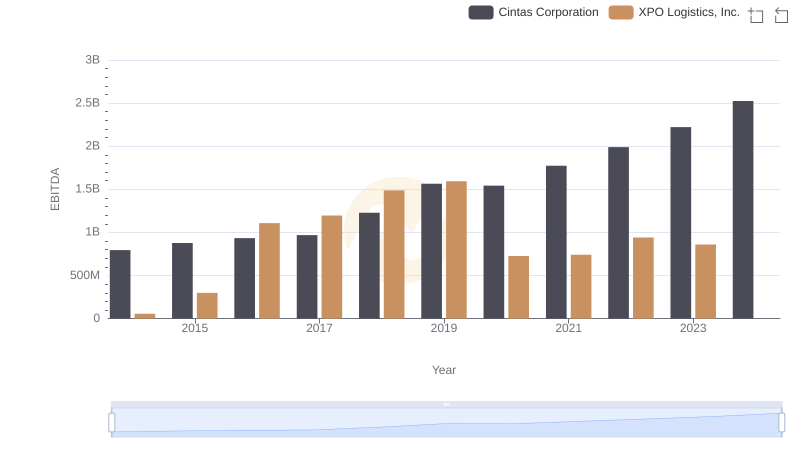
Cintas Corporation and XPO Logistics, Inc.: A Detailed Examination of EBITDA Performance