| __timestamp | Cintas Corporation | Jacobs Engineering Group Inc. |
|---|---|---|
| Wednesday, January 1, 2014 | 2637426000 | 10621373000 |
| Thursday, January 1, 2015 | 2555549000 | 10146494000 |
| Friday, January 1, 2016 | 2775588000 | 9196326000 |
| Sunday, January 1, 2017 | 2943086000 | 8250536000 |
| Monday, January 1, 2018 | 3568109000 | 12156276000 |
| Tuesday, January 1, 2019 | 3763715000 | 10260840000 |
| Wednesday, January 1, 2020 | 3851372000 | 10980307000 |
| Friday, January 1, 2021 | 3801689000 | 11048860000 |
| Saturday, January 1, 2022 | 4222213000 | 11595785000 |
| Sunday, January 1, 2023 | 4642401000 | 12879099000 |
| Monday, January 1, 2024 | 4910199000 | 8668185000 |
Infusing magic into the data realm
In the competitive landscape of corporate America, cost efficiency is a critical metric for success. This analysis delves into the cost of revenue trends for Cintas Corporation and Jacobs Engineering Group Inc. from 2014 to 2024. Over this decade, Cintas has demonstrated a steady increase in cost efficiency, with a notable 86% rise in their cost of revenue, peaking at approximately $4.9 billion in 2024. In contrast, Jacobs Engineering experienced fluctuations, with a peak in 2023 at around $12.9 billion, followed by a significant drop in 2024. This divergence highlights Cintas's consistent growth strategy, while Jacobs's volatility suggests a more dynamic approach to managing costs. As businesses navigate the complexities of the modern economy, understanding these trends offers valuable insights into strategic financial management.
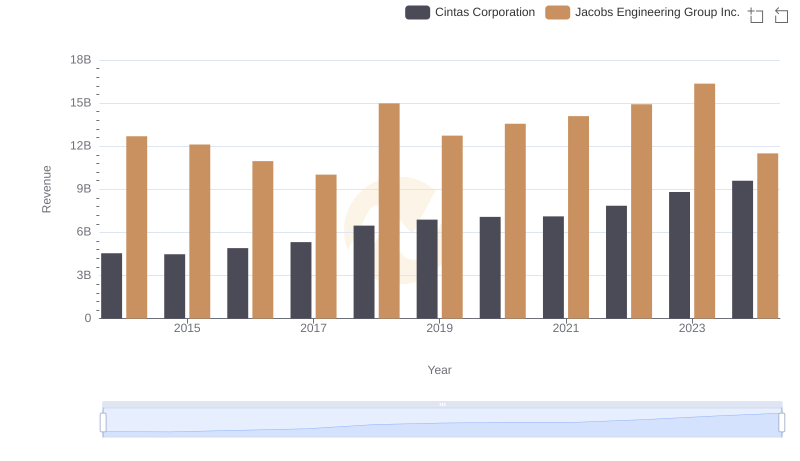
Comparing Revenue Performance: Cintas Corporation or Jacobs Engineering Group Inc.?
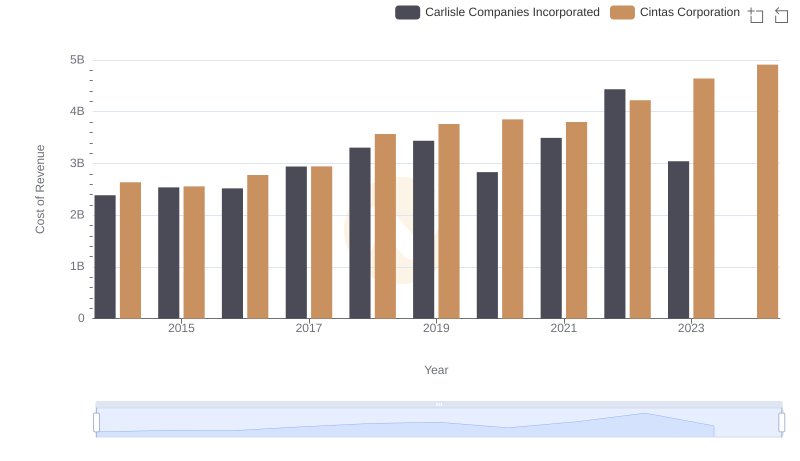
Cost of Revenue: Key Insights for Cintas Corporation and Carlisle Companies Incorporated
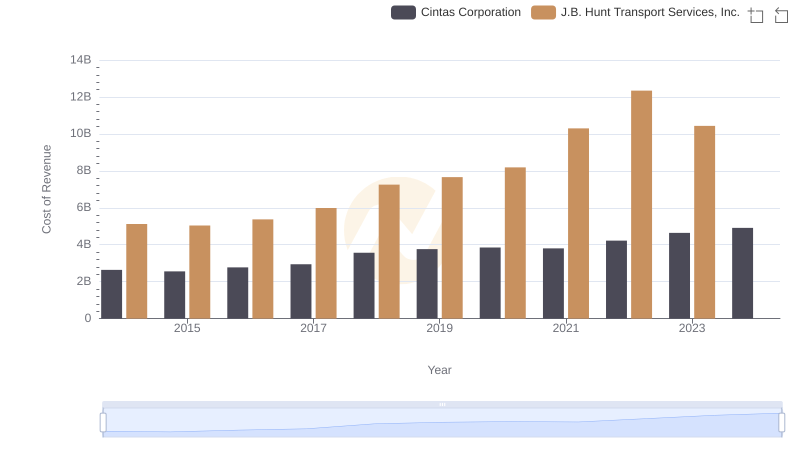
Cintas Corporation vs J.B. Hunt Transport Services, Inc.: Efficiency in Cost of Revenue Explored
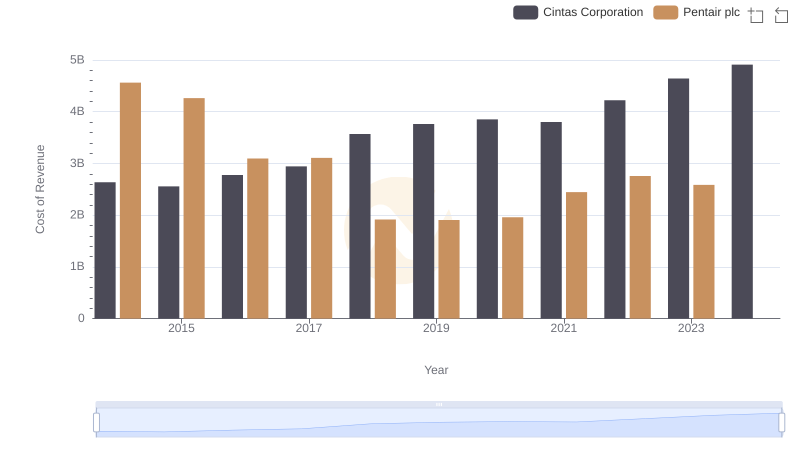
Cost of Revenue Comparison: Cintas Corporation vs Pentair plc
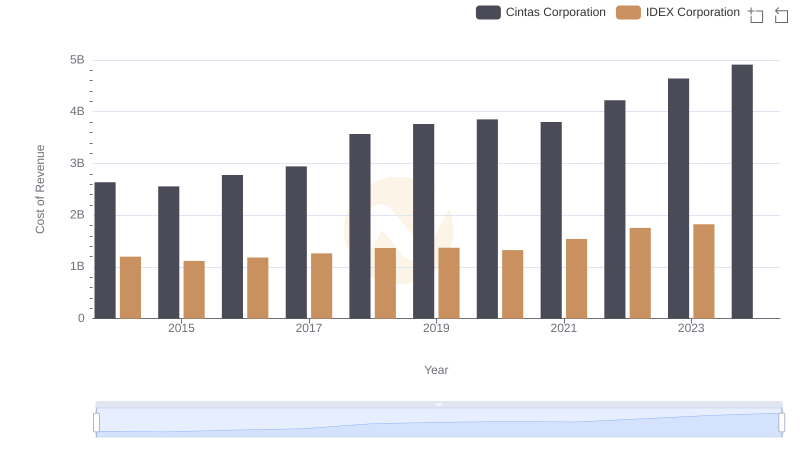
Cintas Corporation vs IDEX Corporation: Efficiency in Cost of Revenue Explored
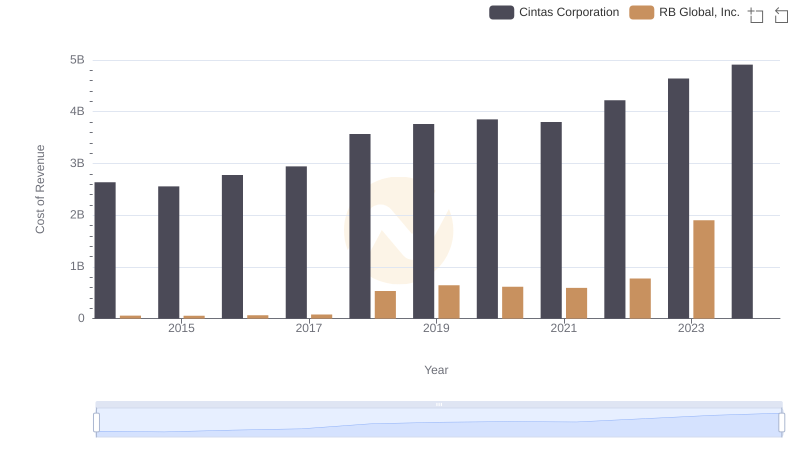
Cintas Corporation vs RB Global, Inc.: Efficiency in Cost of Revenue Explored
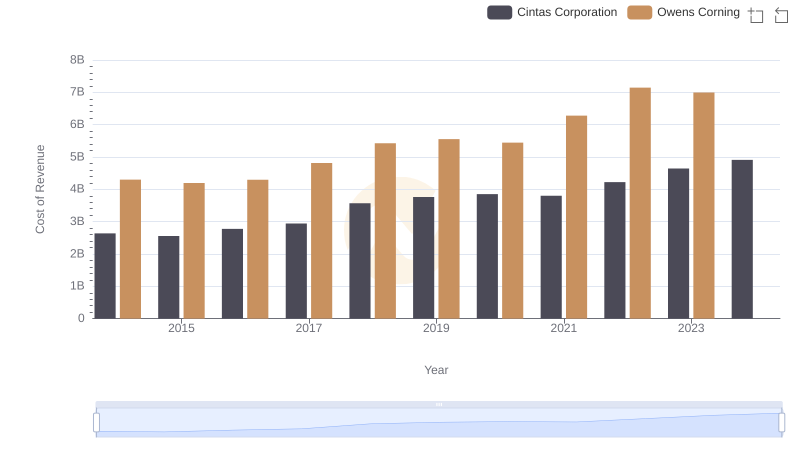
Analyzing Cost of Revenue: Cintas Corporation and Owens Corning
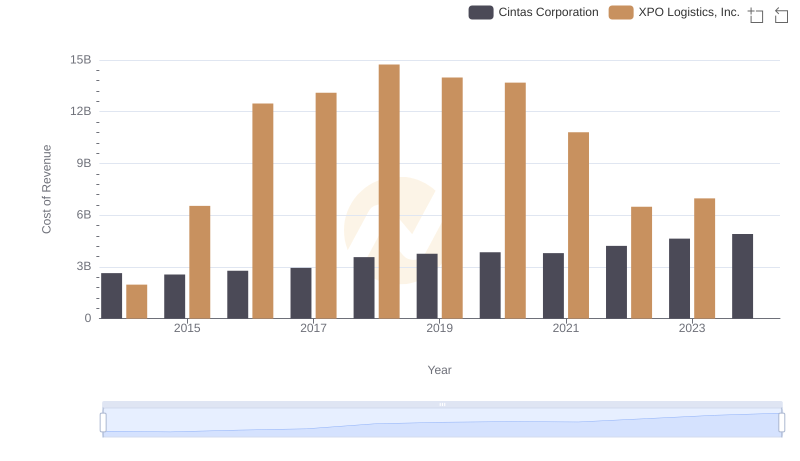
Cost of Revenue Comparison: Cintas Corporation vs XPO Logistics, Inc.
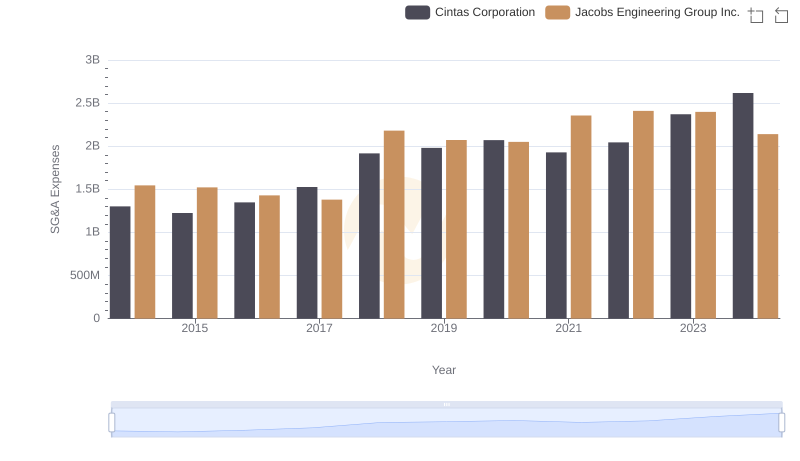
Cost Management Insights: SG&A Expenses for Cintas Corporation and Jacobs Engineering Group Inc.