| __timestamp | Cintas Corporation | Comfort Systems USA, Inc. |
|---|---|---|
| Wednesday, January 1, 2014 | 1302752000 | 207652000 |
| Thursday, January 1, 2015 | 1224930000 | 228965000 |
| Friday, January 1, 2016 | 1348122000 | 243201000 |
| Sunday, January 1, 2017 | 1527380000 | 266586000 |
| Monday, January 1, 2018 | 1916792000 | 296986000 |
| Tuesday, January 1, 2019 | 1980644000 | 340005000 |
| Wednesday, January 1, 2020 | 2071052000 | 357777000 |
| Friday, January 1, 2021 | 1929159000 | 376309000 |
| Saturday, January 1, 2022 | 2044876000 | 489344000 |
| Sunday, January 1, 2023 | 2370704000 | 536188999 |
| Monday, January 1, 2024 | 2617783000 |
Data in motion
In the competitive landscape of corporate America, understanding the nuances of Selling, General, and Administrative (SG&A) expenses is crucial. Over the past decade, Cintas Corporation has consistently outpaced Comfort Systems USA, Inc. in SG&A expenditures. From 2014 to 2023, Cintas saw a remarkable 100% increase in these expenses, peaking at $2.37 billion in 2023. In contrast, Comfort Systems USA, Inc. experienced a more modest growth of approximately 158%, reaching $536 million in the same year.
This trend highlights Cintas's aggressive expansion and investment in administrative capabilities, while Comfort Systems USA, Inc. maintains a more conservative approach. Notably, data for 2024 is incomplete, suggesting potential shifts in strategy or reporting. As businesses navigate economic uncertainties, these insights into SG&A trends offer valuable perspectives on corporate priorities and financial health.
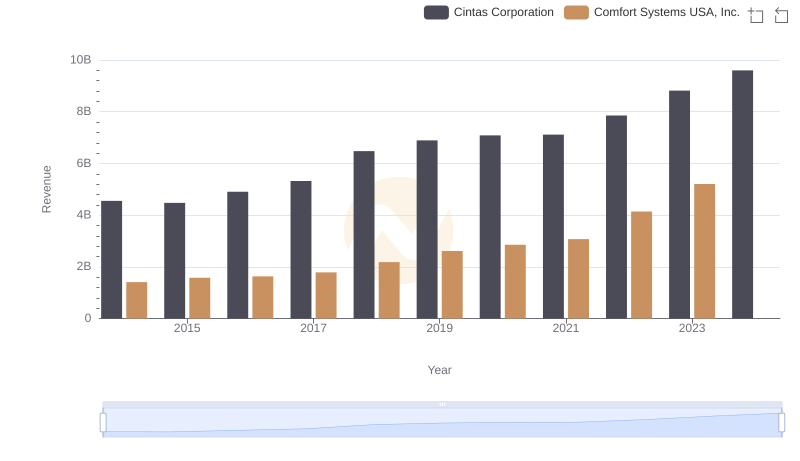
Cintas Corporation and Comfort Systems USA, Inc.: A Comprehensive Revenue Analysis
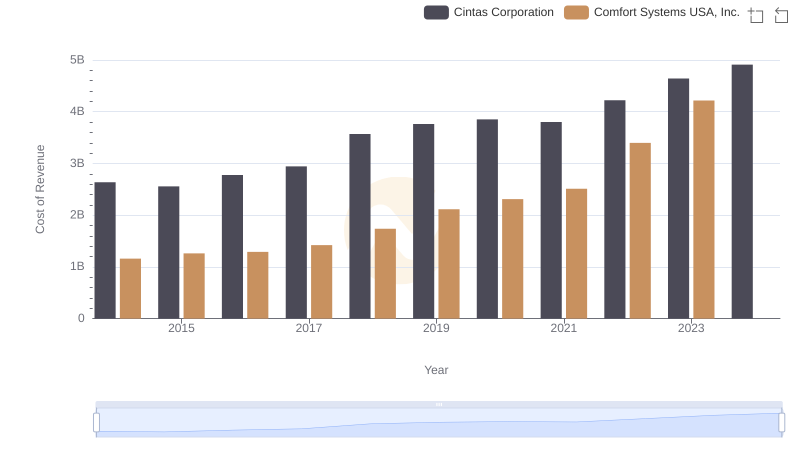
Cost of Revenue Comparison: Cintas Corporation vs Comfort Systems USA, Inc.

Key Insights on Gross Profit: Cintas Corporation vs Comfort Systems USA, Inc.
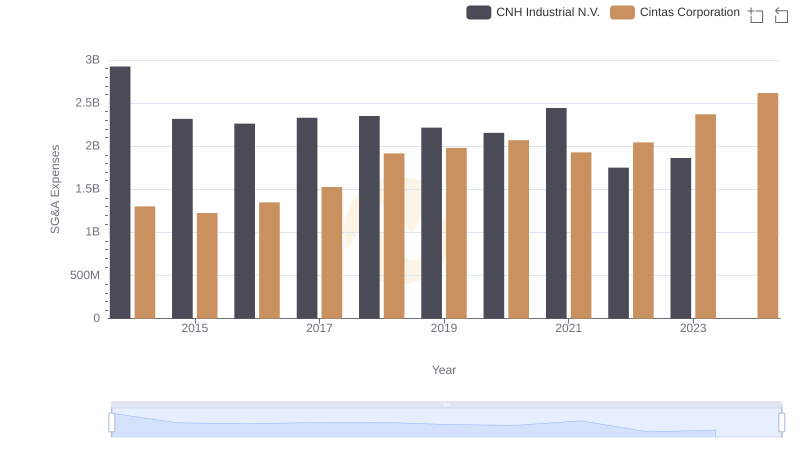
Cintas Corporation or CNH Industrial N.V.: Who Manages SG&A Costs Better?
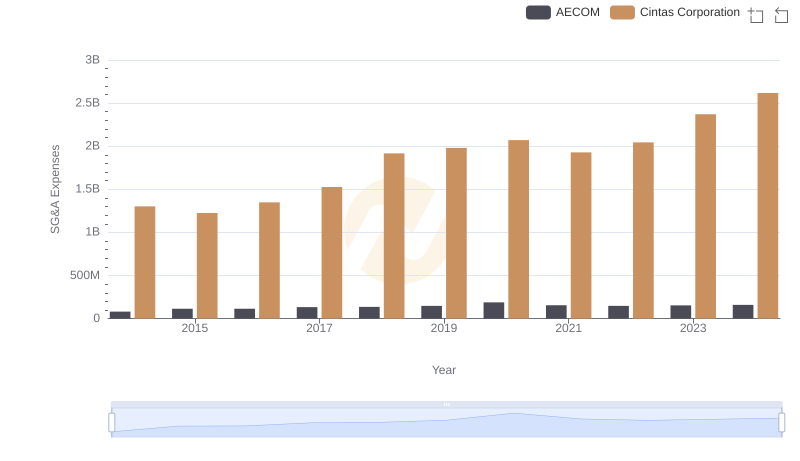
SG&A Efficiency Analysis: Comparing Cintas Corporation and AECOM

Comparing SG&A Expenses: Cintas Corporation vs Graco Inc. Trends and Insights
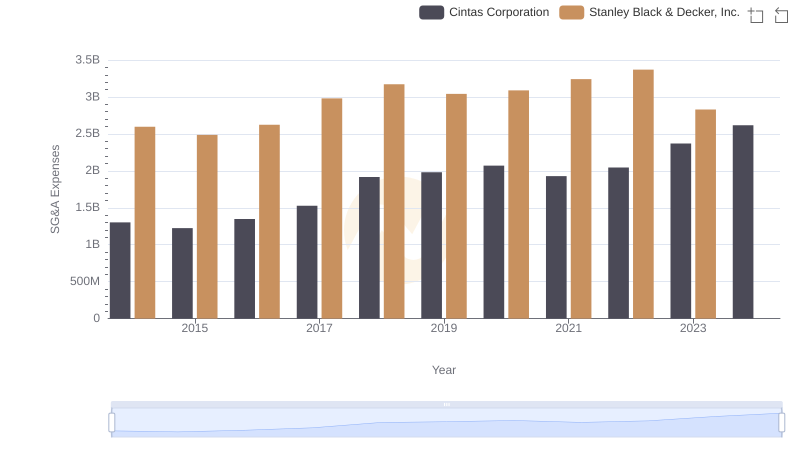
Cintas Corporation or Stanley Black & Decker, Inc.: Who Manages SG&A Costs Better?
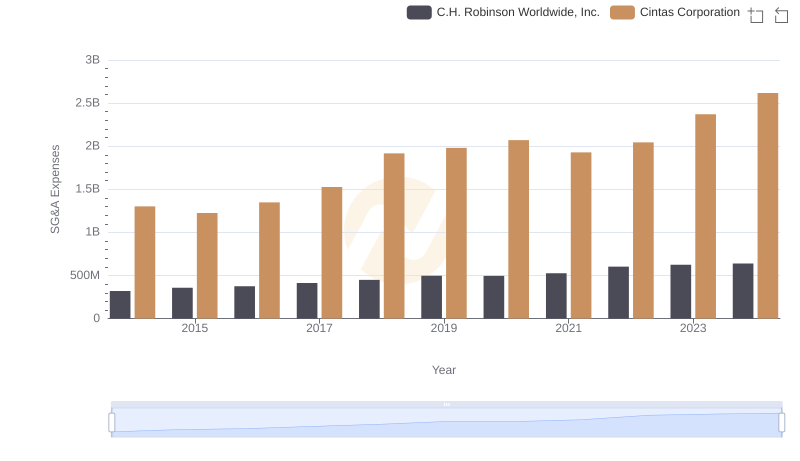
Cintas Corporation or C.H. Robinson Worldwide, Inc.: Who Manages SG&A Costs Better?
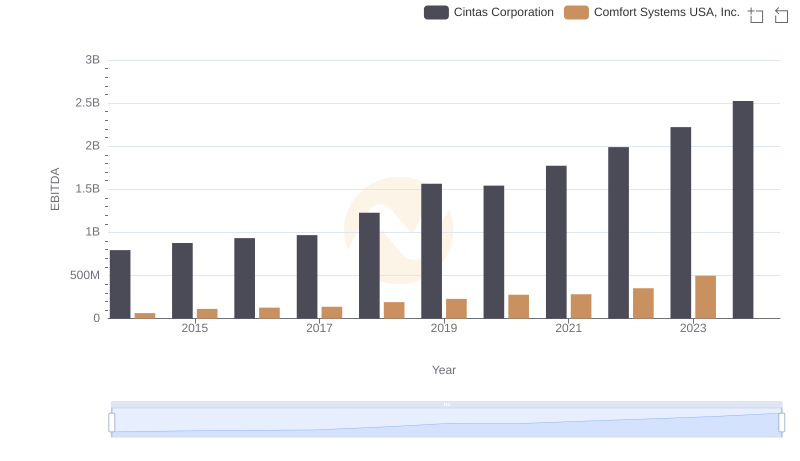
EBITDA Performance Review: Cintas Corporation vs Comfort Systems USA, Inc.