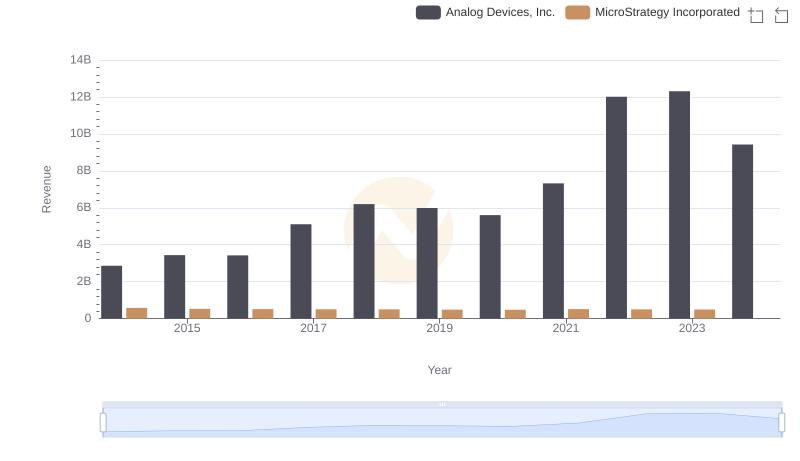
| __timestamp | Analog Devices, Inc. | MicroStrategy Incorporated |
|---|---|---|
| Wednesday, January 1, 2014 | 1034585000 | 135210000 |
| Thursday, January 1, 2015 | 1175830000 | 101108000 |
| Friday, January 1, 2016 | 1194236000 | 93147000 |
| Sunday, January 1, 2017 | 2045907000 | 96649000 |
| Monday, January 1, 2018 | 1967640000 | 99499000 |
| Tuesday, January 1, 2019 | 1977315000 | 99974000 |
| Wednesday, January 1, 2020 | 1912578000 | 91055000 |
| Friday, January 1, 2021 | 2793274000 | 91909000 |
| Saturday, January 1, 2022 | 4481479000 | 102989000 |
| Sunday, January 1, 2023 | 4428321000 | 109944000 |
| Monday, January 1, 2024 | 4045814000 | 129468000 |
Unleashing the power of data
In the ever-evolving landscape of technology, understanding the cost of revenue is crucial for investors and analysts alike. Analog Devices, Inc. and MicroStrategy Incorporated, two giants in their respective fields, offer a fascinating comparison. From 2014 to 2023, Analog Devices saw a staggering 330% increase in its cost of revenue, peaking in 2022. This reflects its aggressive expansion and investment in cutting-edge technologies. In contrast, MicroStrategy's cost of revenue remained relatively stable, with a modest 20% increase over the same period. This stability suggests a focus on optimizing existing operations rather than expansion. Notably, data for 2024 is missing for MicroStrategy, indicating potential reporting delays or strategic shifts. As we look to the future, these trends offer valuable insights into each company's strategic priorities and market positioning.
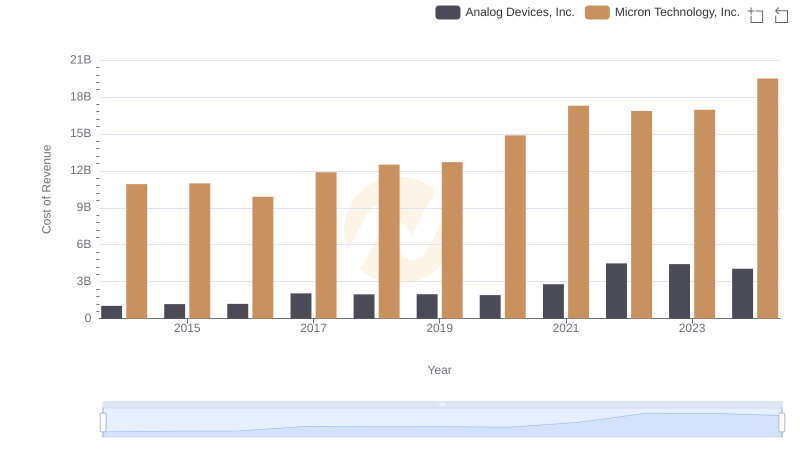
Analog Devices, Inc. vs Micron Technology, Inc.: Efficiency in Cost of Revenue Explored
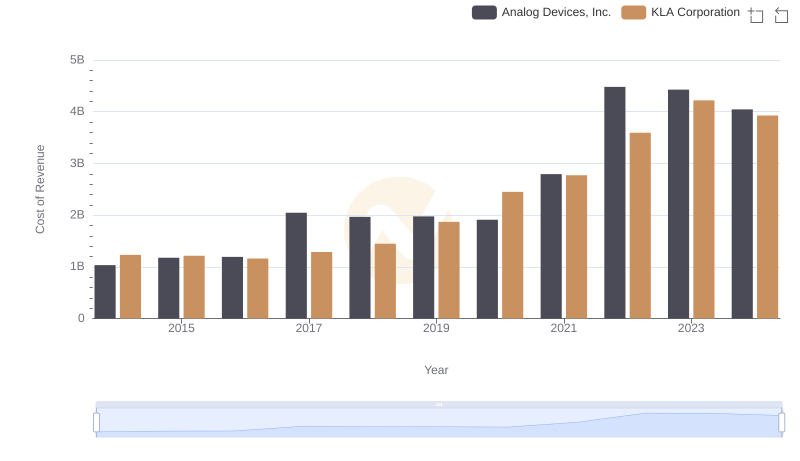
Cost of Revenue Comparison: Analog Devices, Inc. vs KLA Corporation
Who Generates More Revenue? Analog Devices, Inc. or MicroStrategy Incorporated
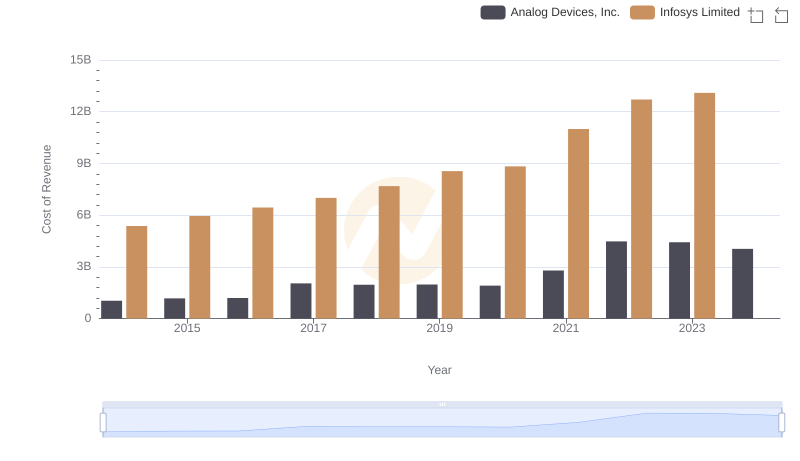
Comparing Cost of Revenue Efficiency: Analog Devices, Inc. vs Infosys Limited
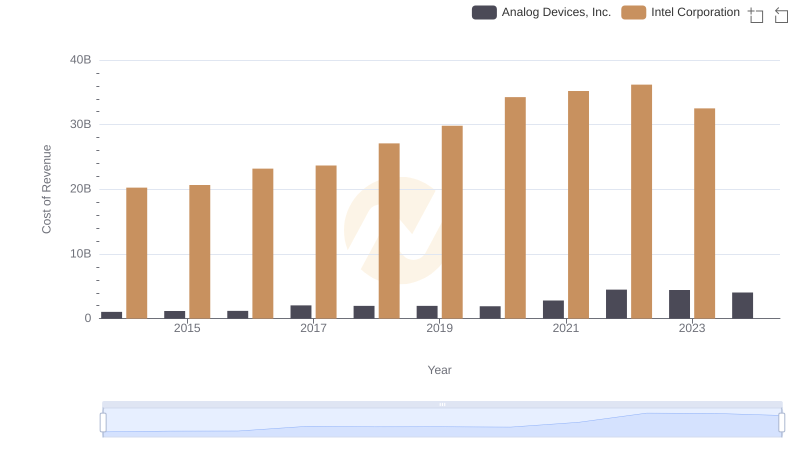
Cost of Revenue: Key Insights for Analog Devices, Inc. and Intel Corporation
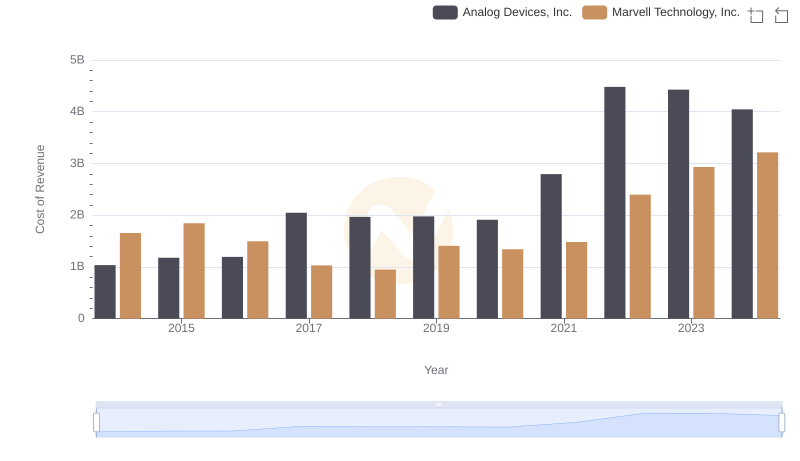
Cost of Revenue Comparison: Analog Devices, Inc. vs Marvell Technology, Inc.
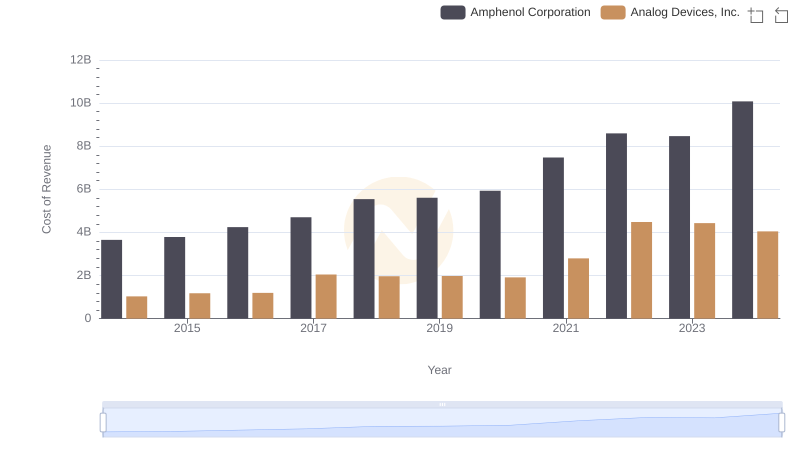
Cost of Revenue Comparison: Analog Devices, Inc. vs Amphenol Corporation
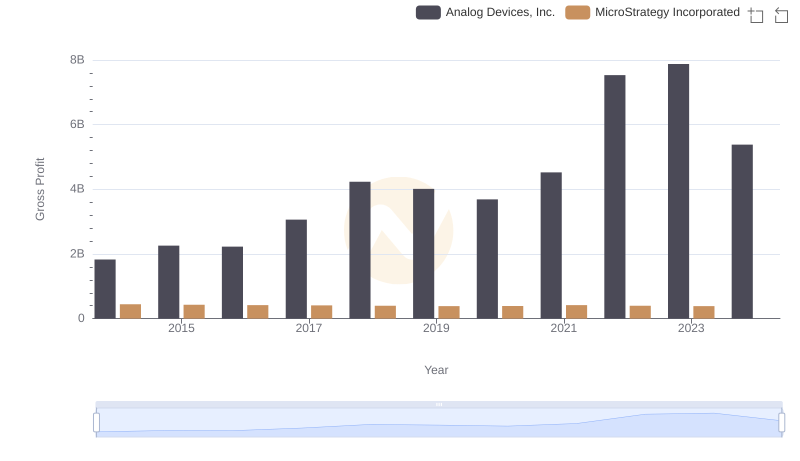
Gross Profit Comparison: Analog Devices, Inc. and MicroStrategy Incorporated Trends
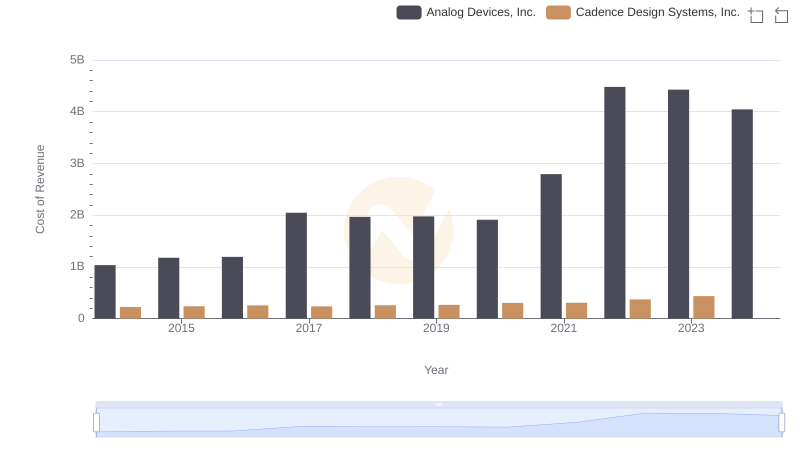
Analog Devices, Inc. vs Cadence Design Systems, Inc.: Efficiency in Cost of Revenue Explored
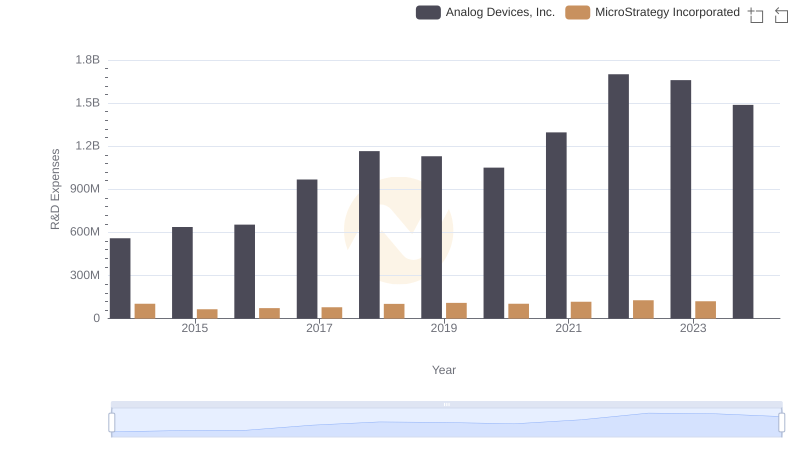
Comparing Innovation Spending: Analog Devices, Inc. and MicroStrategy Incorporated
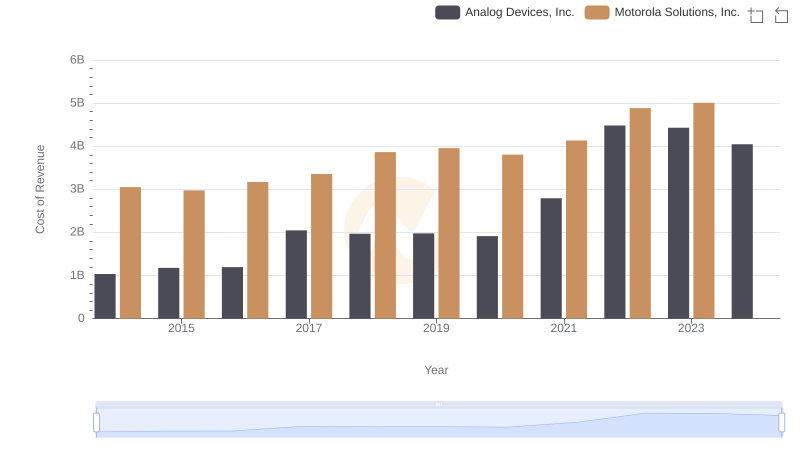
Cost of Revenue Comparison: Analog Devices, Inc. vs Motorola Solutions, Inc.
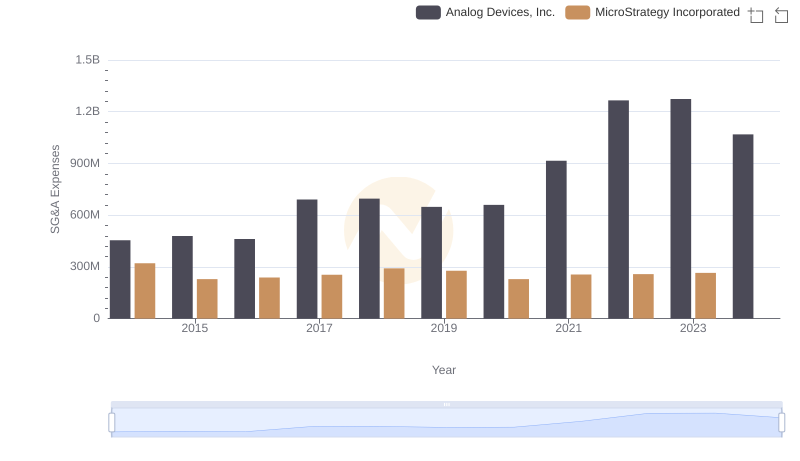
Comparing SG&A Expenses: Analog Devices, Inc. vs MicroStrategy Incorporated Trends and Insights