| __timestamp | Analog Devices, Inc. | KLA Corporation |
|---|---|---|
| Wednesday, January 1, 2014 | 1034585000 | 1232962000 |
| Thursday, January 1, 2015 | 1175830000 | 1215229000 |
| Friday, January 1, 2016 | 1194236000 | 1163391000 |
| Sunday, January 1, 2017 | 2045907000 | 1287547000 |
| Monday, January 1, 2018 | 1967640000 | 1447369000 |
| Tuesday, January 1, 2019 | 1977315000 | 1869377000 |
| Wednesday, January 1, 2020 | 1912578000 | 2449561000 |
| Friday, January 1, 2021 | 2793274000 | 2772165000 |
| Saturday, January 1, 2022 | 4481479000 | 3592441000 |
| Sunday, January 1, 2023 | 4428321000 | 4218307000 |
| Monday, January 1, 2024 | 4045814000 | 3928073000 |
Unleashing the power of data
In the ever-evolving landscape of semiconductor manufacturing, understanding cost structures is pivotal. Over the past decade, from 2014 to 2024, Analog Devices, Inc. and KLA Corporation have showcased intriguing trends in their cost of revenue. Analog Devices, Inc. saw a significant rise, with costs peaking in 2022 at approximately 4.48 billion, marking a 333% increase from 2014. Meanwhile, KLA Corporation's costs also surged, reaching around 4.22 billion in 2023, a 242% increase from 2014. Notably, both companies experienced their highest costs in the early 2020s, reflecting broader industry trends and economic conditions. This comparison not only highlights the competitive nature of the semiconductor industry but also underscores the strategic financial maneuvers these giants employ to maintain their market positions.
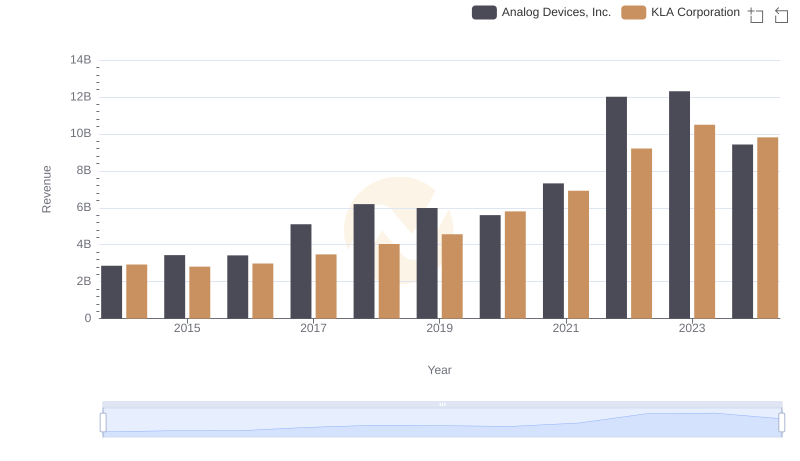
Analog Devices, Inc. or KLA Corporation: Who Leads in Yearly Revenue?
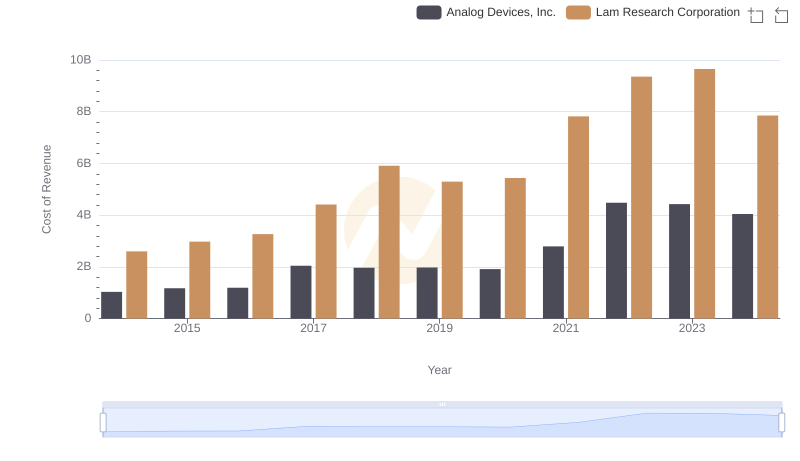
Comparing Cost of Revenue Efficiency: Analog Devices, Inc. vs Lam Research Corporation
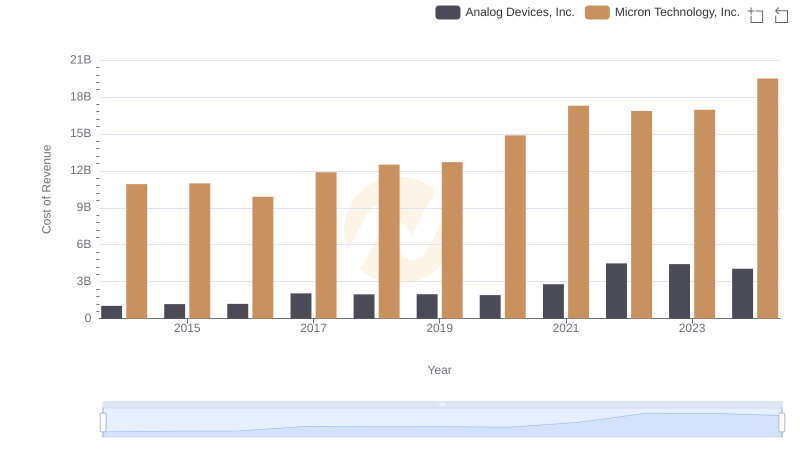
Analog Devices, Inc. vs Micron Technology, Inc.: Efficiency in Cost of Revenue Explored
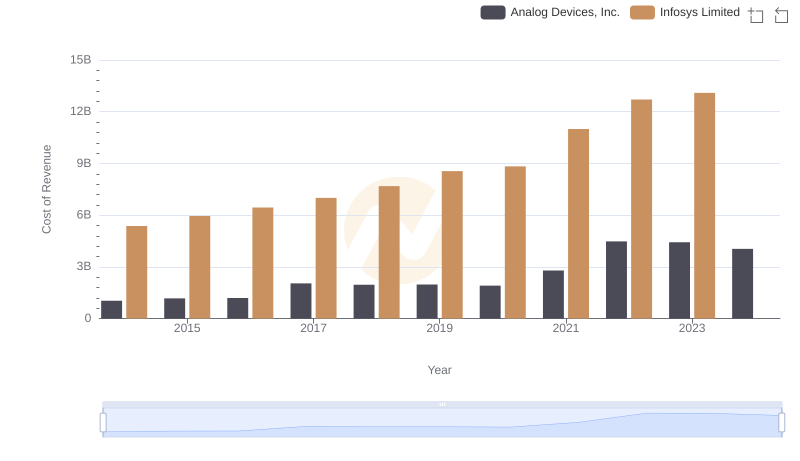
Comparing Cost of Revenue Efficiency: Analog Devices, Inc. vs Infosys Limited
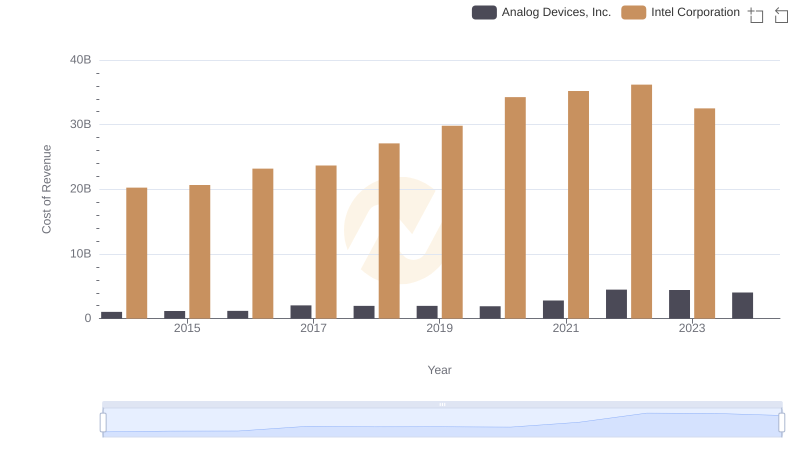
Cost of Revenue: Key Insights for Analog Devices, Inc. and Intel Corporation
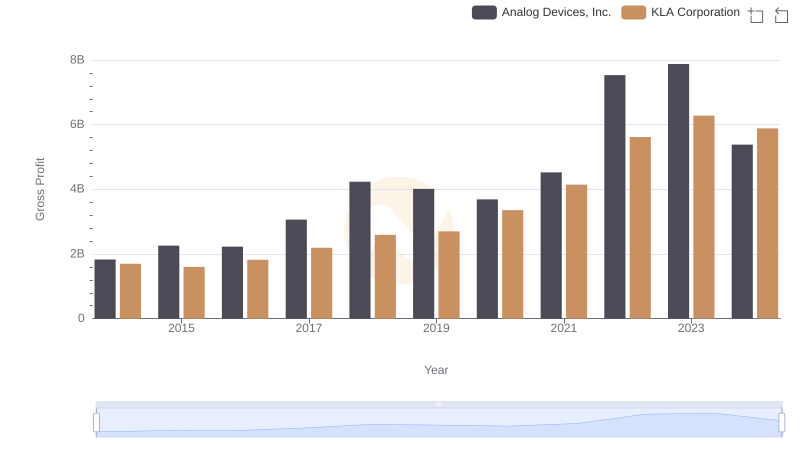
Key Insights on Gross Profit: Analog Devices, Inc. vs KLA Corporation
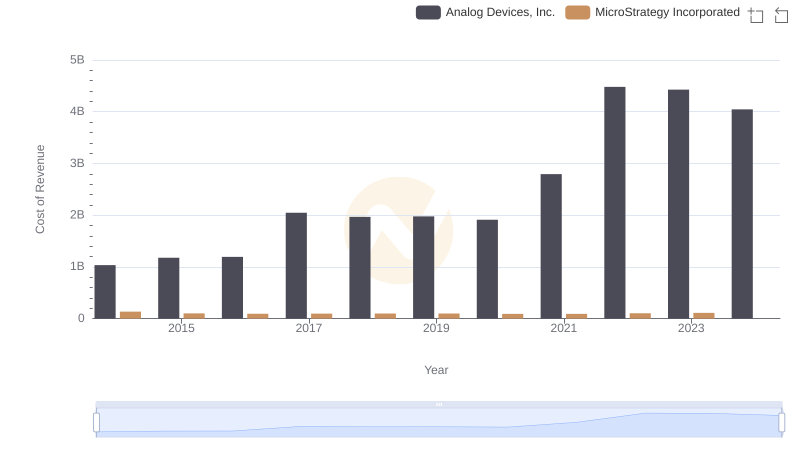
Cost of Revenue Comparison: Analog Devices, Inc. vs MicroStrategy Incorporated
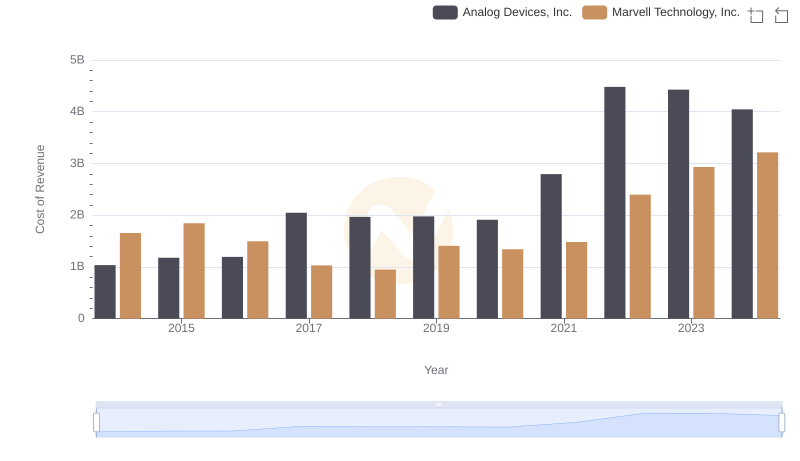
Cost of Revenue Comparison: Analog Devices, Inc. vs Marvell Technology, Inc.
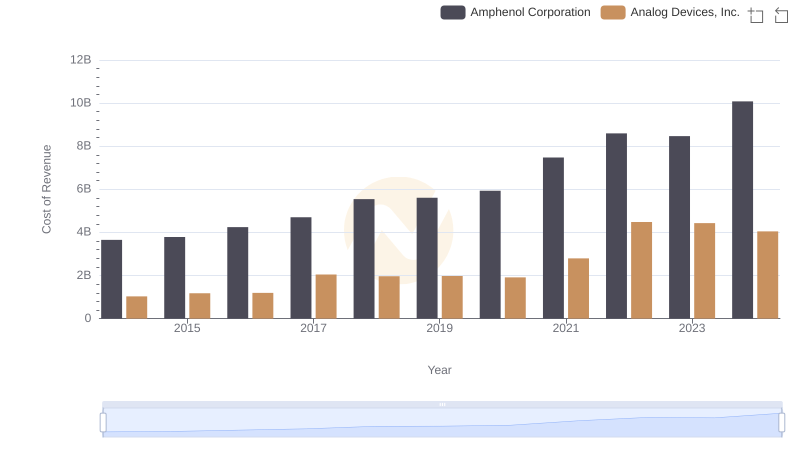
Cost of Revenue Comparison: Analog Devices, Inc. vs Amphenol Corporation
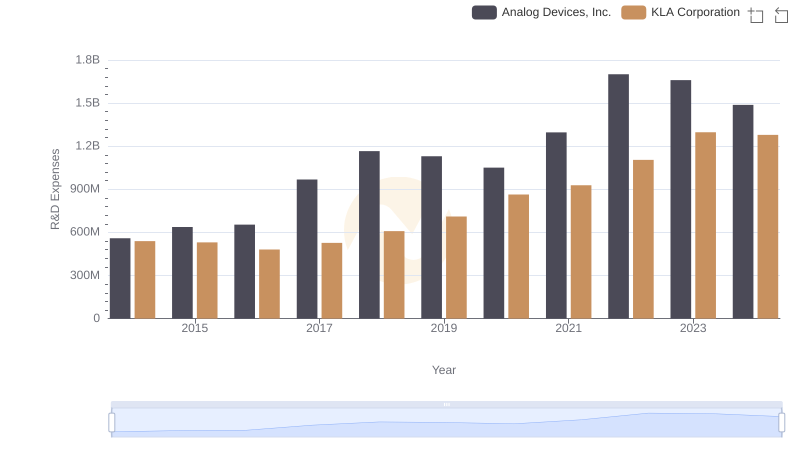
Analog Devices, Inc. or KLA Corporation: Who Invests More in Innovation?
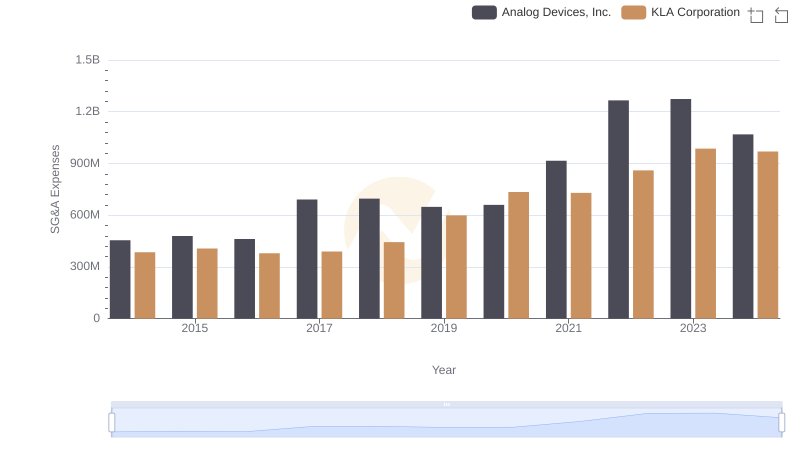
Who Optimizes SG&A Costs Better? Analog Devices, Inc. or KLA Corporation
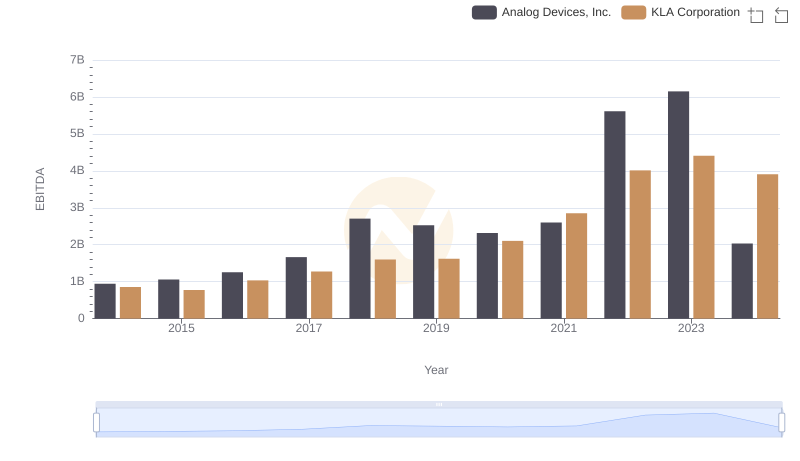
EBITDA Metrics Evaluated: Analog Devices, Inc. vs KLA Corporation