| __timestamp | Analog Devices, Inc. | Intel Corporation |
|---|---|---|
| Wednesday, January 1, 2014 | 1034585000 | 20261000000 |
| Thursday, January 1, 2015 | 1175830000 | 20676000000 |
| Friday, January 1, 2016 | 1194236000 | 23196000000 |
| Sunday, January 1, 2017 | 2045907000 | 23692000000 |
| Monday, January 1, 2018 | 1967640000 | 27111000000 |
| Tuesday, January 1, 2019 | 1977315000 | 29825000000 |
| Wednesday, January 1, 2020 | 1912578000 | 34255000000 |
| Friday, January 1, 2021 | 2793274000 | 35209000000 |
| Saturday, January 1, 2022 | 4481479000 | 36188000000 |
| Sunday, January 1, 2023 | 4428321000 | 32517000000 |
| Monday, January 1, 2024 | 4045814000 | 35756000000 |
Unleashing the power of data
In the ever-evolving landscape of the semiconductor industry, understanding cost structures is crucial. From 2014 to 2023, Analog Devices, Inc. and Intel Corporation have shown distinct trends in their cost of revenue. Analog Devices, Inc. saw a significant increase of over 330% from 2014 to 2023, peaking in 2022. This growth reflects strategic investments and scaling operations. Meanwhile, Intel Corporation's cost of revenue rose by approximately 60% over the same period, with a notable peak in 2022, followed by a decline in 2023. This fluctuation may indicate shifts in production efficiency or market dynamics. Notably, data for 2024 is incomplete, highlighting the need for ongoing analysis. These insights provide a window into the financial strategies of two industry giants, offering valuable lessons for stakeholders and investors alike.
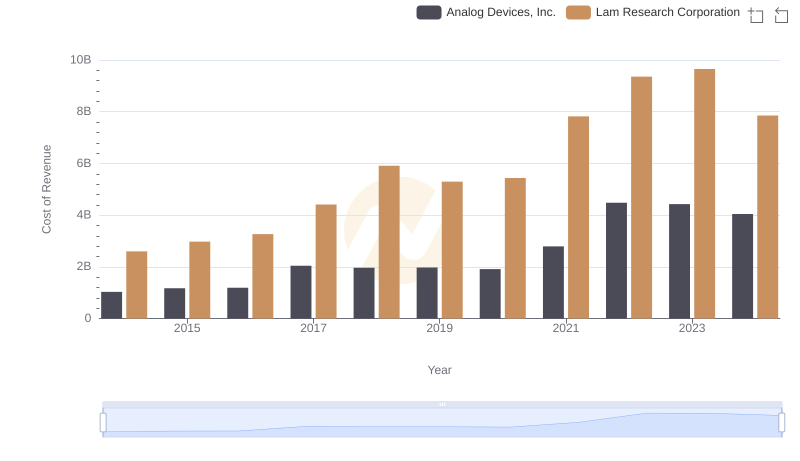
Comparing Cost of Revenue Efficiency: Analog Devices, Inc. vs Lam Research Corporation
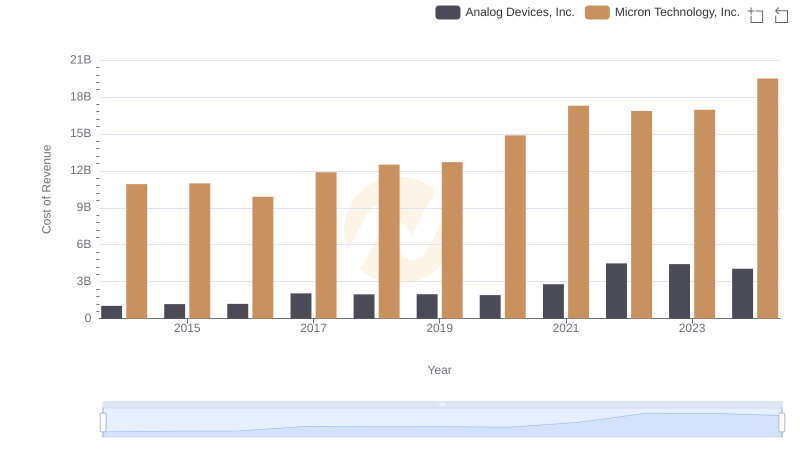
Analog Devices, Inc. vs Micron Technology, Inc.: Efficiency in Cost of Revenue Explored
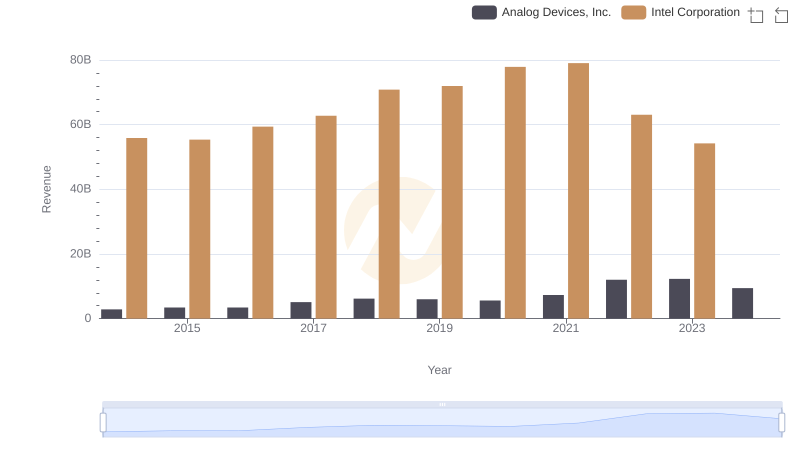
Revenue Insights: Analog Devices, Inc. and Intel Corporation Performance Compared
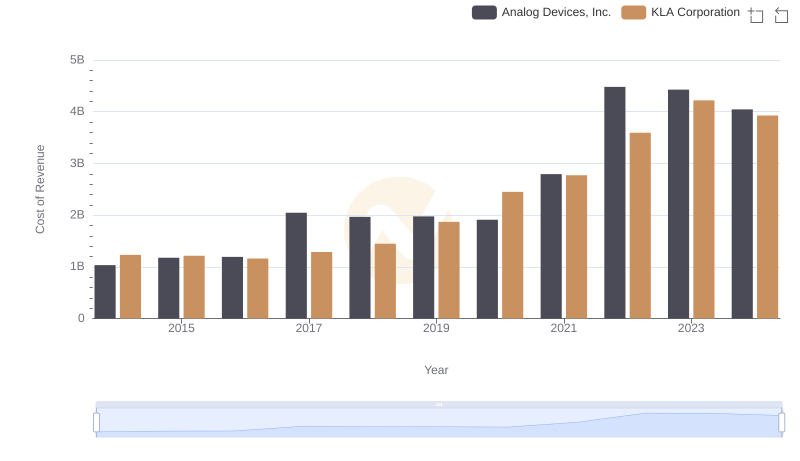
Cost of Revenue Comparison: Analog Devices, Inc. vs KLA Corporation
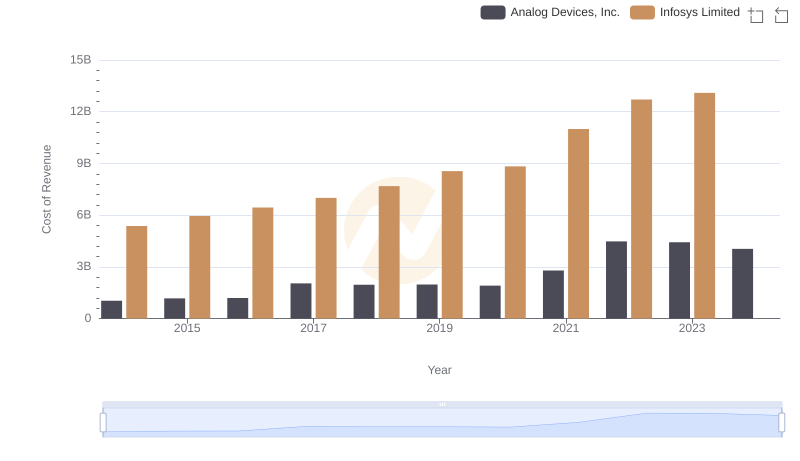
Comparing Cost of Revenue Efficiency: Analog Devices, Inc. vs Infosys Limited
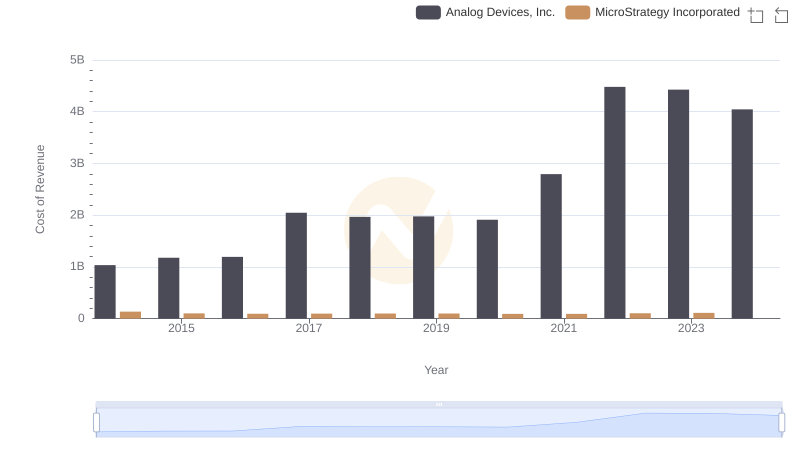
Cost of Revenue Comparison: Analog Devices, Inc. vs MicroStrategy Incorporated
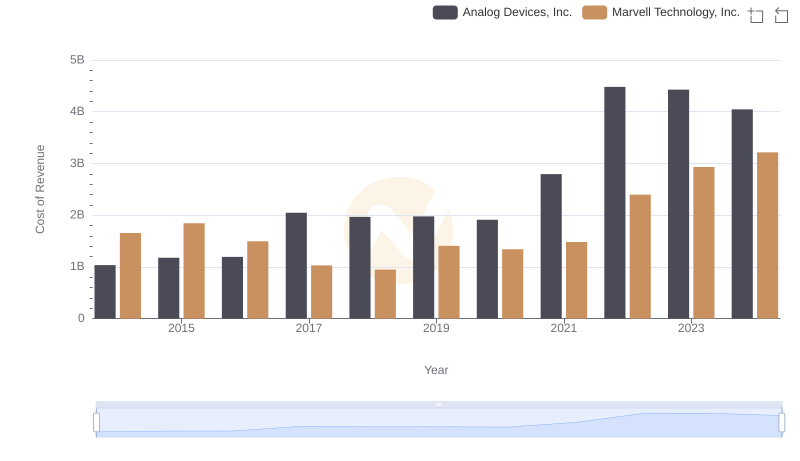
Cost of Revenue Comparison: Analog Devices, Inc. vs Marvell Technology, Inc.
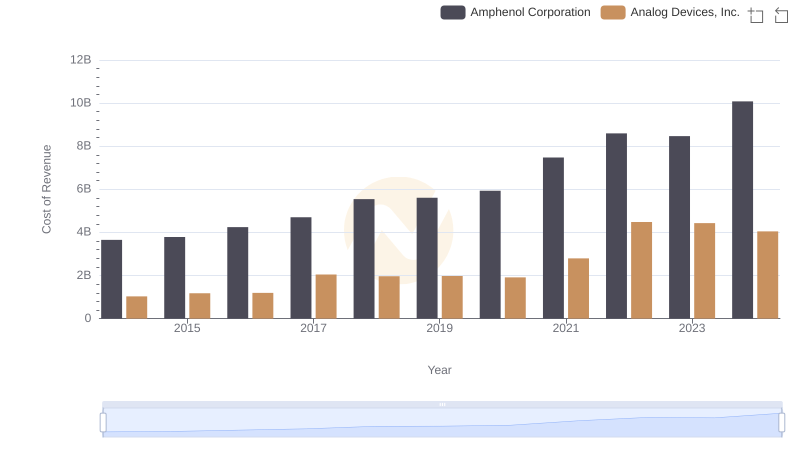
Cost of Revenue Comparison: Analog Devices, Inc. vs Amphenol Corporation
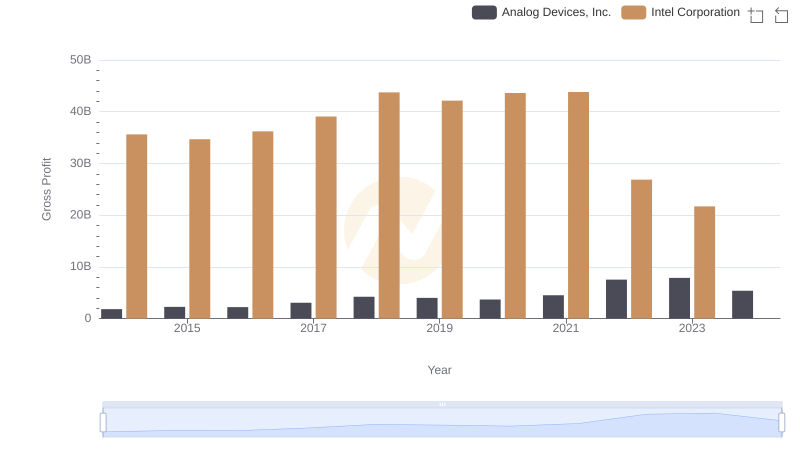
Who Generates Higher Gross Profit? Analog Devices, Inc. or Intel Corporation
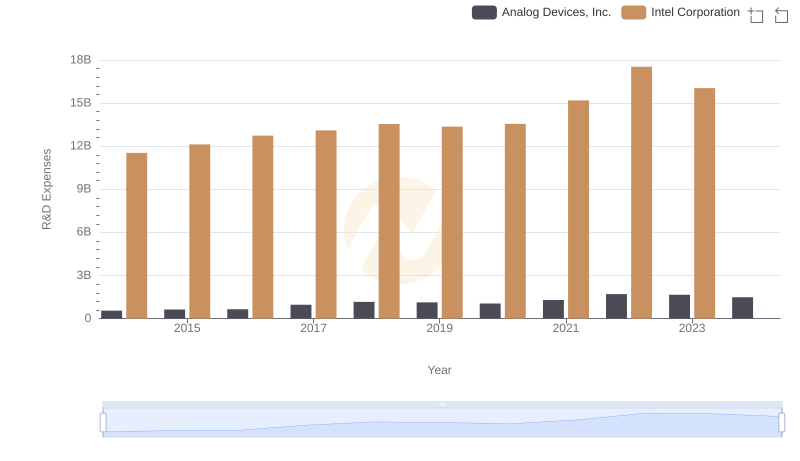
Research and Development Investment: Analog Devices, Inc. vs Intel Corporation
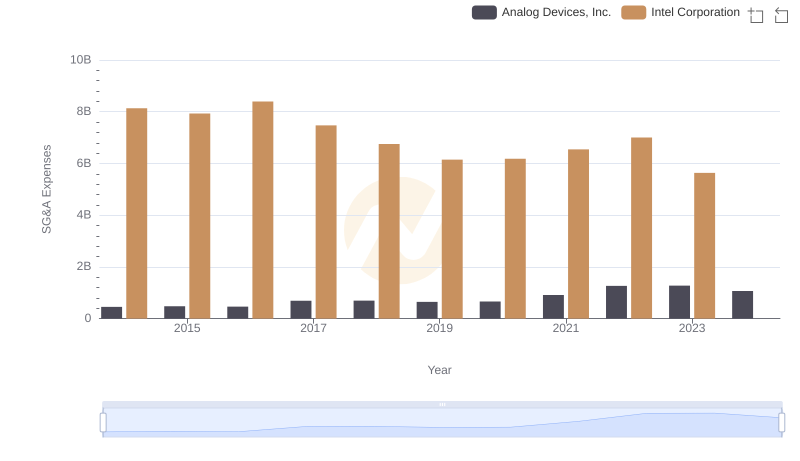
Selling, General, and Administrative Costs: Analog Devices, Inc. vs Intel Corporation
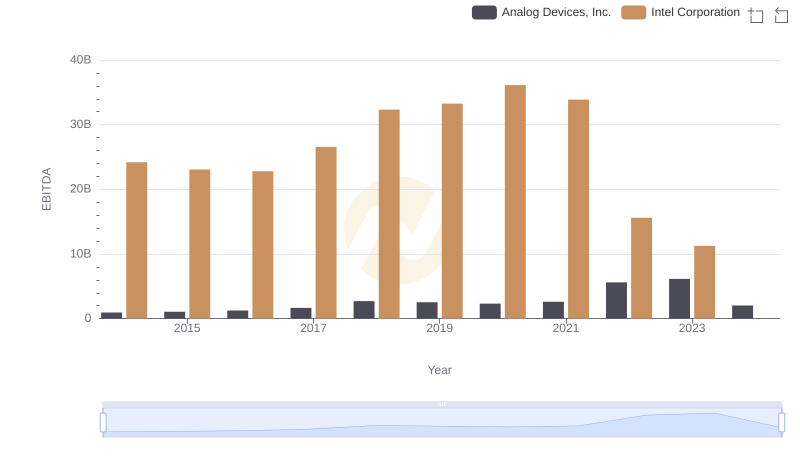
Professional EBITDA Benchmarking: Analog Devices, Inc. vs Intel Corporation