| __timestamp | Analog Devices, Inc. | Motorola Solutions, Inc. |
|---|---|---|
| Wednesday, January 1, 2014 | 1034585000 | 3050000000 |
| Thursday, January 1, 2015 | 1175830000 | 2976000000 |
| Friday, January 1, 2016 | 1194236000 | 3169000000 |
| Sunday, January 1, 2017 | 2045907000 | 3356000000 |
| Monday, January 1, 2018 | 1967640000 | 3863000000 |
| Tuesday, January 1, 2019 | 1977315000 | 3956000000 |
| Wednesday, January 1, 2020 | 1912578000 | 3806000000 |
| Friday, January 1, 2021 | 2793274000 | 4131000000 |
| Saturday, January 1, 2022 | 4481479000 | 4883000000 |
| Sunday, January 1, 2023 | 4428321000 | 5008000000 |
| Monday, January 1, 2024 | 4045814000 | 5305000000 |
Unleashing insights
In the ever-evolving landscape of technology, understanding cost structures is crucial. Over the past decade, Analog Devices, Inc. and Motorola Solutions, Inc. have showcased distinct trajectories in their cost of revenue. From 2014 to 2023, Analog Devices saw a staggering 328% increase in costs, peaking in 2022 with a 4.48 billion USD equivalent. Meanwhile, Motorola Solutions maintained a steadier growth, with costs rising by approximately 64% over the same period, reaching their zenith in 2023. This divergence highlights Analog Devices' aggressive expansion and investment strategies, contrasting with Motorola's more measured approach. Notably, data for 2024 is incomplete, leaving room for speculation on future trends. As these giants continue to innovate, their cost management strategies will be pivotal in shaping their competitive edge.
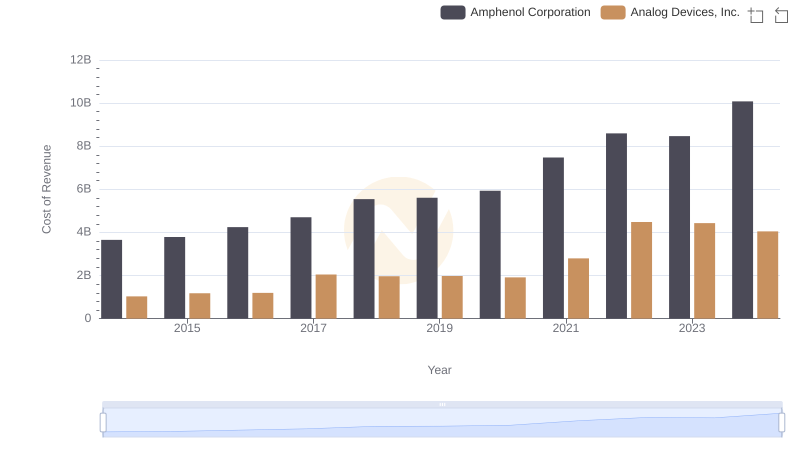
Cost of Revenue Comparison: Analog Devices, Inc. vs Amphenol Corporation
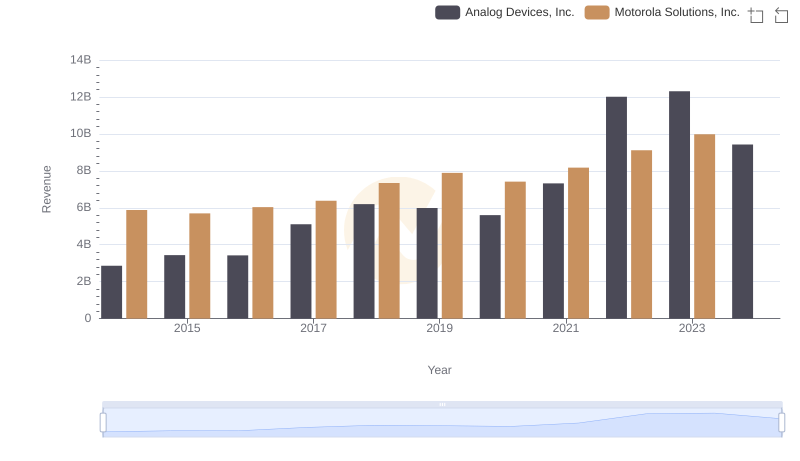
Annual Revenue Comparison: Analog Devices, Inc. vs Motorola Solutions, Inc.
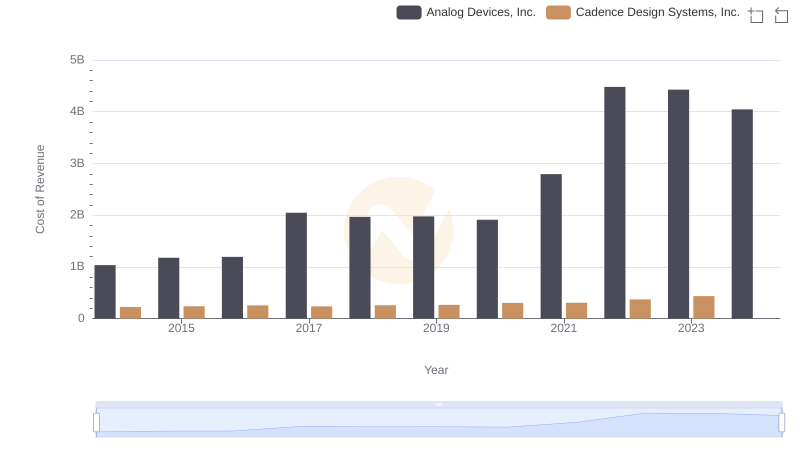
Analog Devices, Inc. vs Cadence Design Systems, Inc.: Efficiency in Cost of Revenue Explored
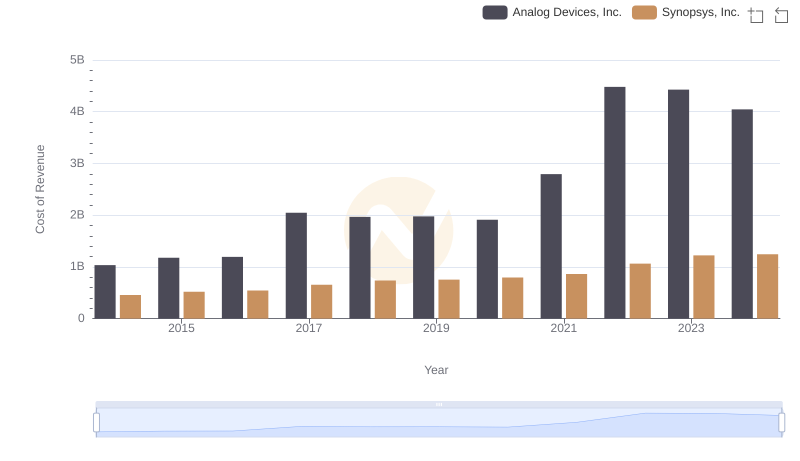
Analog Devices, Inc. vs Synopsys, Inc.: Efficiency in Cost of Revenue Explored
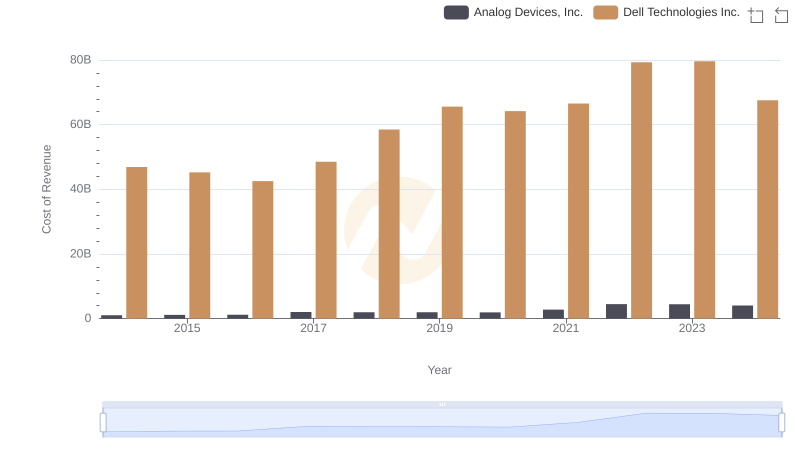
Cost of Revenue: Key Insights for Analog Devices, Inc. and Dell Technologies Inc.
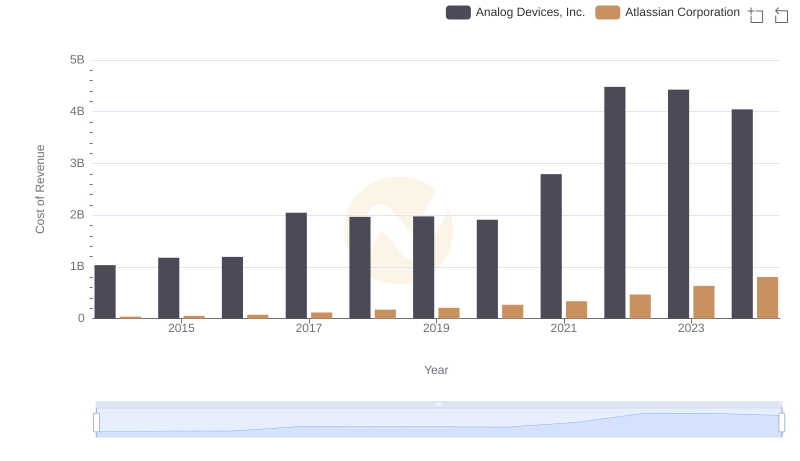
Cost Insights: Breaking Down Analog Devices, Inc. and Atlassian Corporation's Expenses
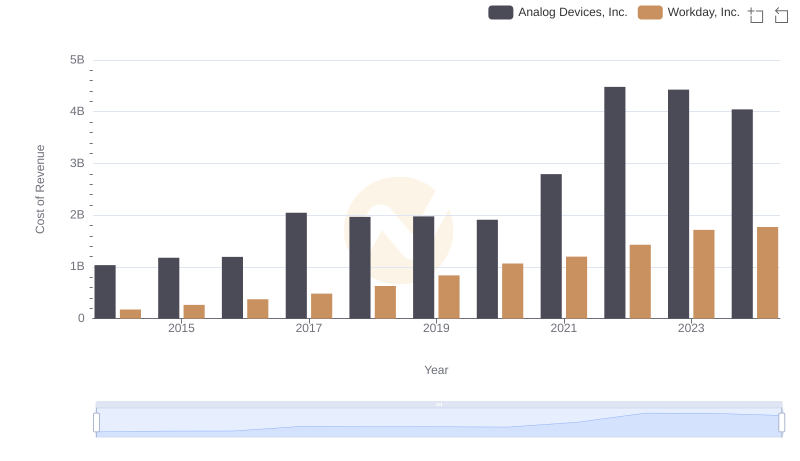
Comparing Cost of Revenue Efficiency: Analog Devices, Inc. vs Workday, Inc.
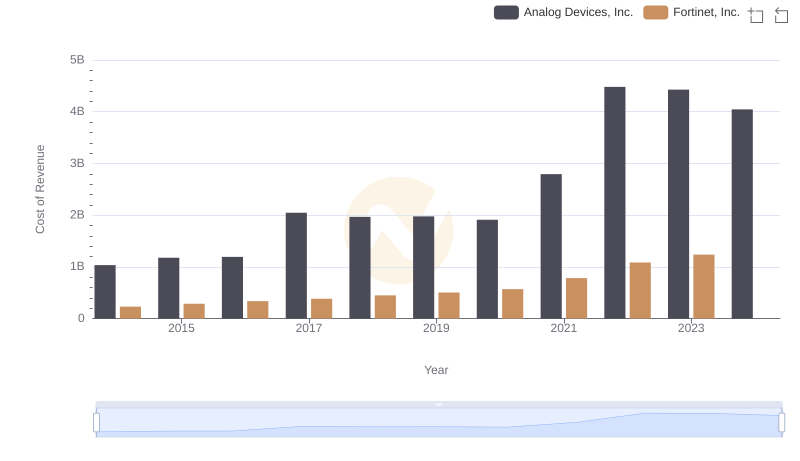
Cost of Revenue: Key Insights for Analog Devices, Inc. and Fortinet, Inc.
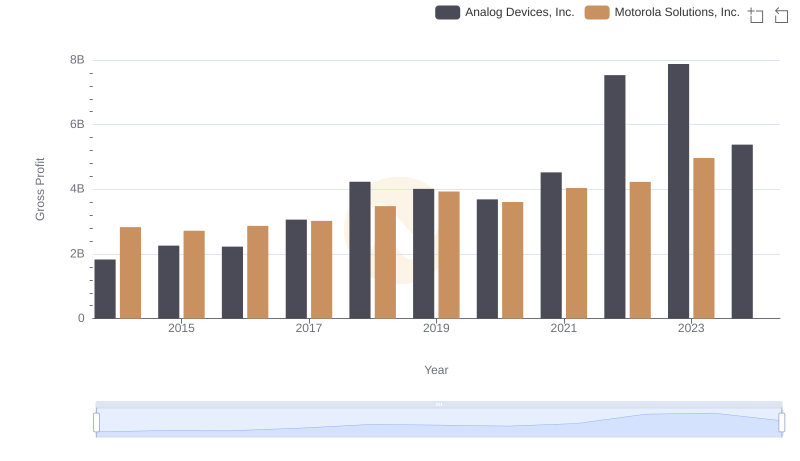
Gross Profit Comparison: Analog Devices, Inc. and Motorola Solutions, Inc. Trends
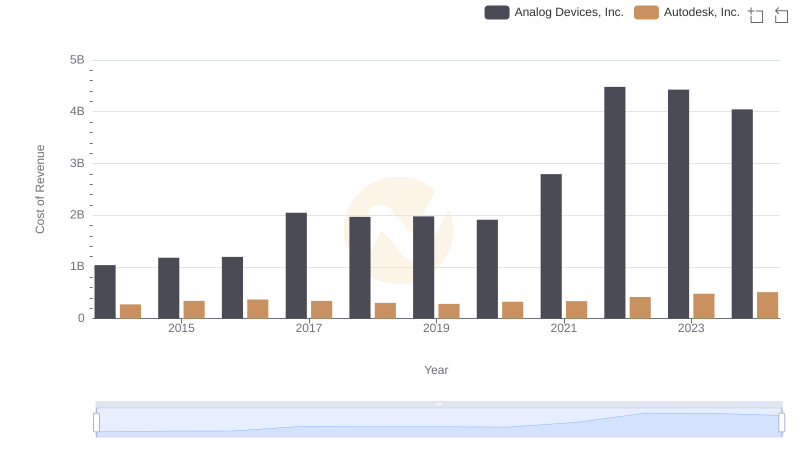
Analyzing Cost of Revenue: Analog Devices, Inc. and Autodesk, Inc.
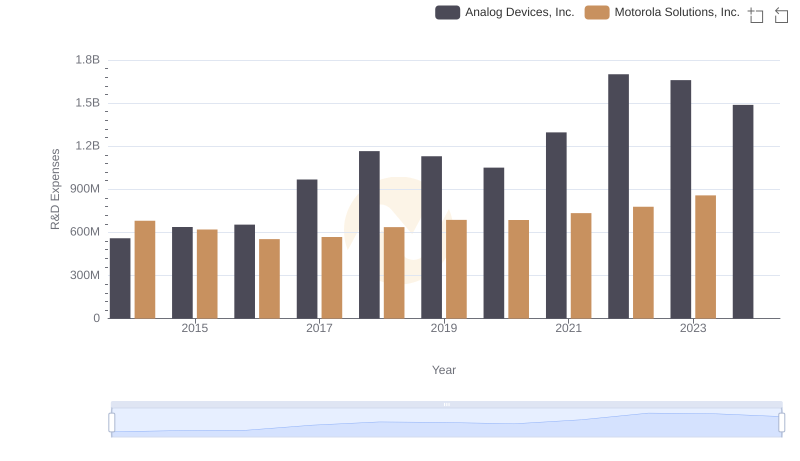
Analyzing R&D Budgets: Analog Devices, Inc. vs Motorola Solutions, Inc.
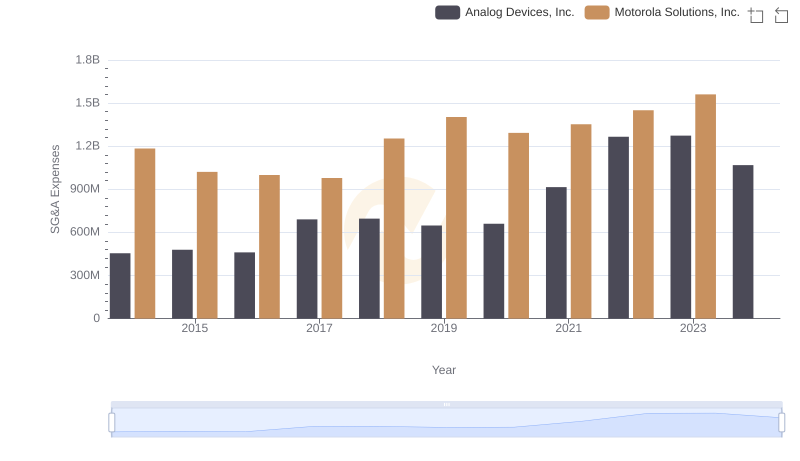
Cost Management Insights: SG&A Expenses for Analog Devices, Inc. and Motorola Solutions, Inc.