| __timestamp | Analog Devices, Inc. | Marvell Technology, Inc. |
|---|---|---|
| Wednesday, January 1, 2014 | 1034585000 | 1654230000 |
| Thursday, January 1, 2015 | 1175830000 | 1843706000 |
| Friday, January 1, 2016 | 1194236000 | 1494736000 |
| Sunday, January 1, 2017 | 2045907000 | 1029527000 |
| Monday, January 1, 2018 | 1967640000 | 947230000 |
| Tuesday, January 1, 2019 | 1977315000 | 1407399000 |
| Wednesday, January 1, 2020 | 1912578000 | 1342220000 |
| Friday, January 1, 2021 | 2793274000 | 1480550000 |
| Saturday, January 1, 2022 | 4481479000 | 2398158000 |
| Sunday, January 1, 2023 | 4428321000 | 2932100000 |
| Monday, January 1, 2024 | 4045814000 | 3214100000 |
Unleashing the power of data
In the ever-evolving landscape of technology, understanding financial trends is crucial. This analysis delves into the cost of revenue for two industry titans, Analog Devices, Inc. and Marvell Technology, Inc., from 2014 to 2024. Over this decade, Analog Devices has seen a remarkable 290% increase in its cost of revenue, peaking in 2022. In contrast, Marvell Technology's cost of revenue grew by approximately 94%, with a notable surge in 2023.
Analog Devices consistently outpaces Marvell in cost of revenue, reflecting its expansive operations and market reach. The year 2022 marked a significant leap for Analog Devices, with costs nearly doubling from 2021. Meanwhile, Marvell's steady growth trajectory highlights its strategic investments and market adaptation. These trends underscore the dynamic nature of the tech industry, where strategic financial management is key to sustaining growth.
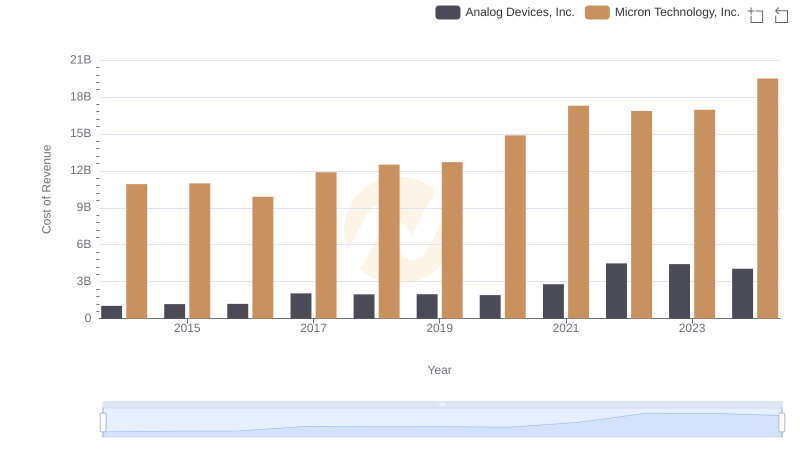
Analog Devices, Inc. vs Micron Technology, Inc.: Efficiency in Cost of Revenue Explored
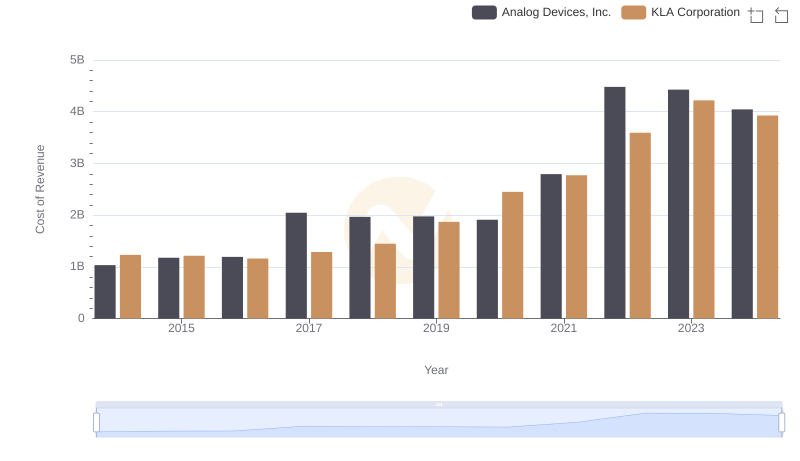
Cost of Revenue Comparison: Analog Devices, Inc. vs KLA Corporation
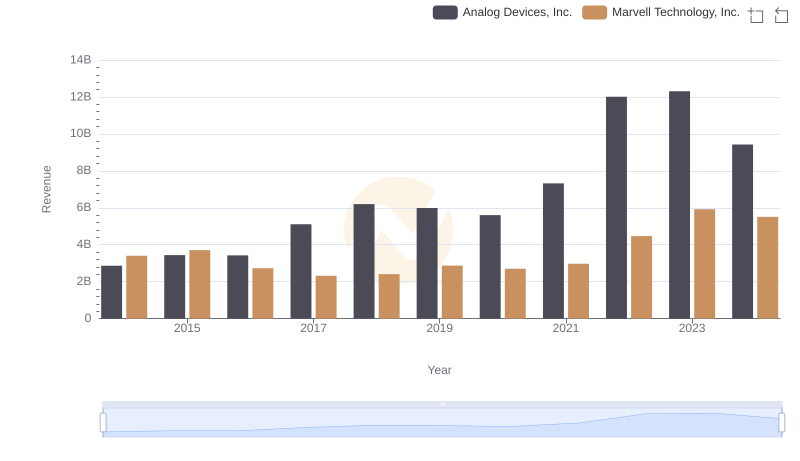
Analog Devices, Inc. vs Marvell Technology, Inc.: Examining Key Revenue Metrics
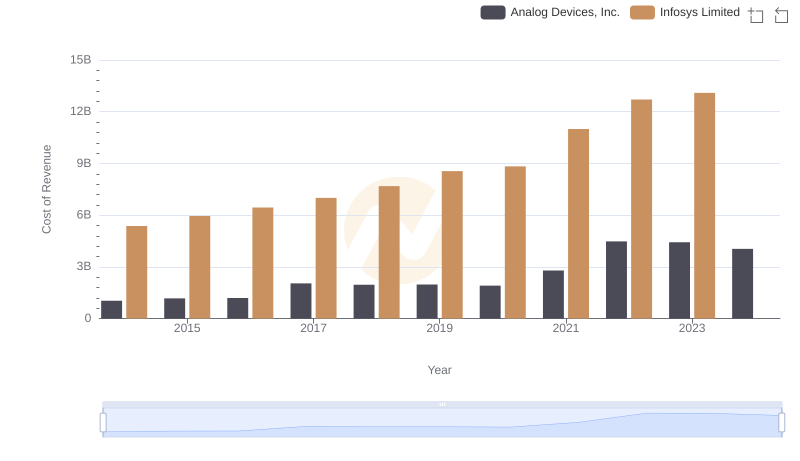
Comparing Cost of Revenue Efficiency: Analog Devices, Inc. vs Infosys Limited
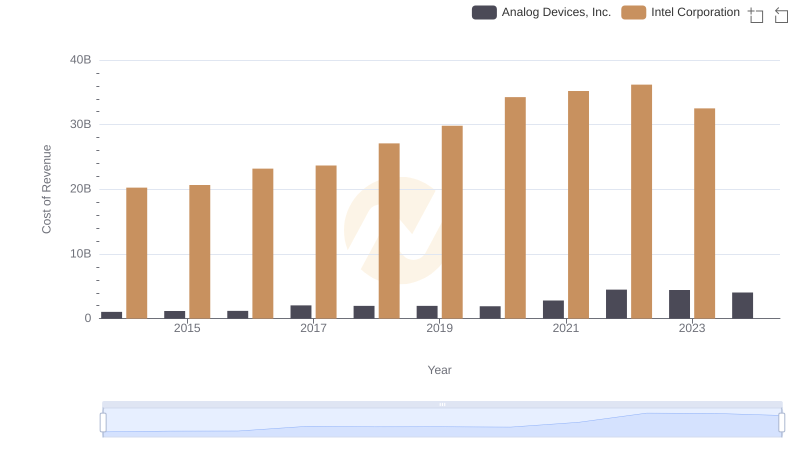
Cost of Revenue: Key Insights for Analog Devices, Inc. and Intel Corporation
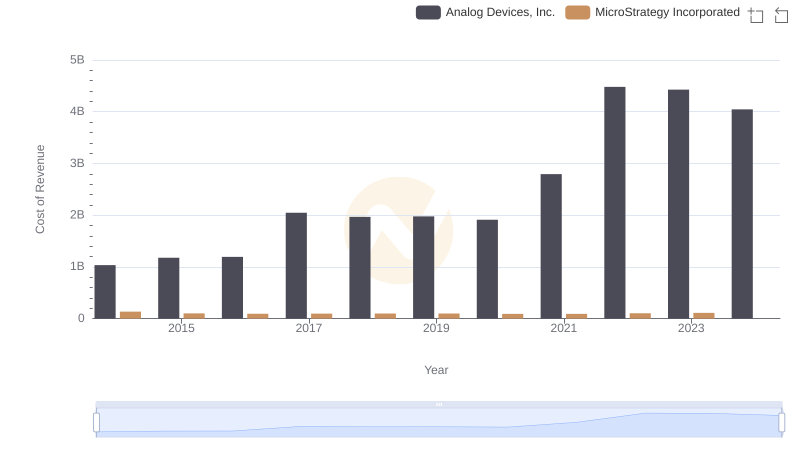
Cost of Revenue Comparison: Analog Devices, Inc. vs MicroStrategy Incorporated
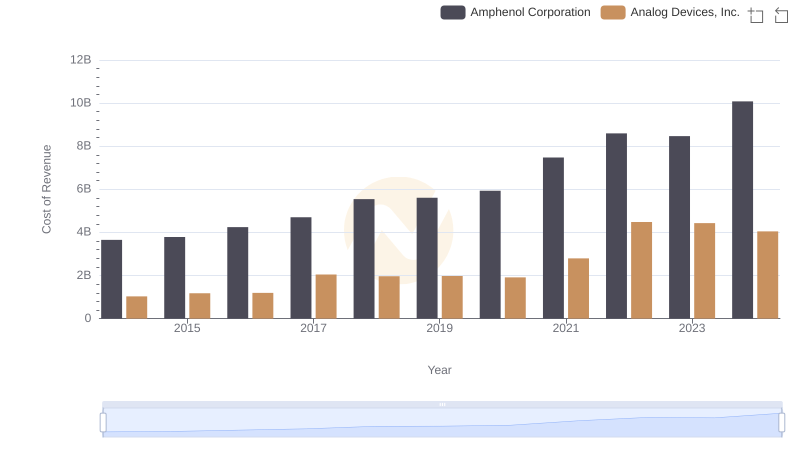
Cost of Revenue Comparison: Analog Devices, Inc. vs Amphenol Corporation
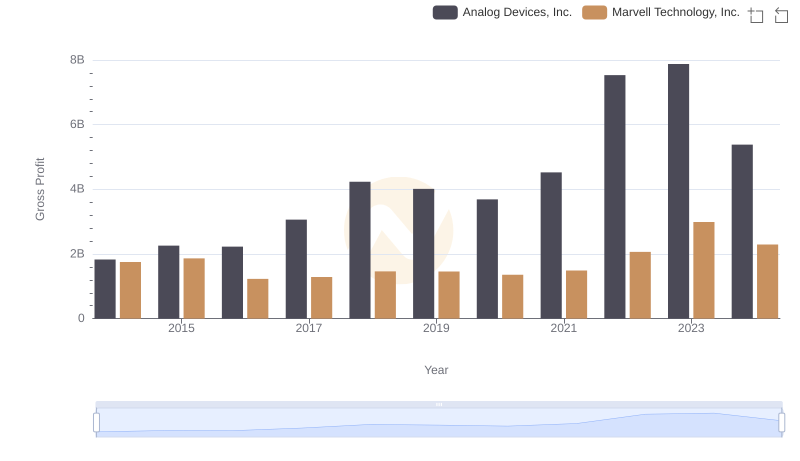
Who Generates Higher Gross Profit? Analog Devices, Inc. or Marvell Technology, Inc.
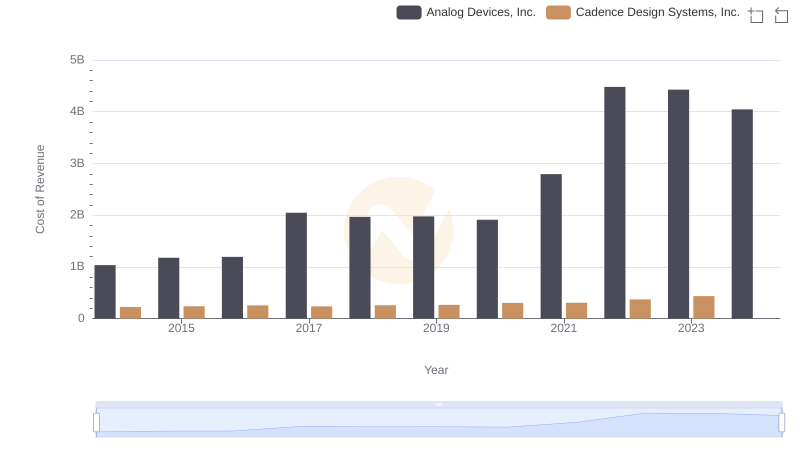
Analog Devices, Inc. vs Cadence Design Systems, Inc.: Efficiency in Cost of Revenue Explored
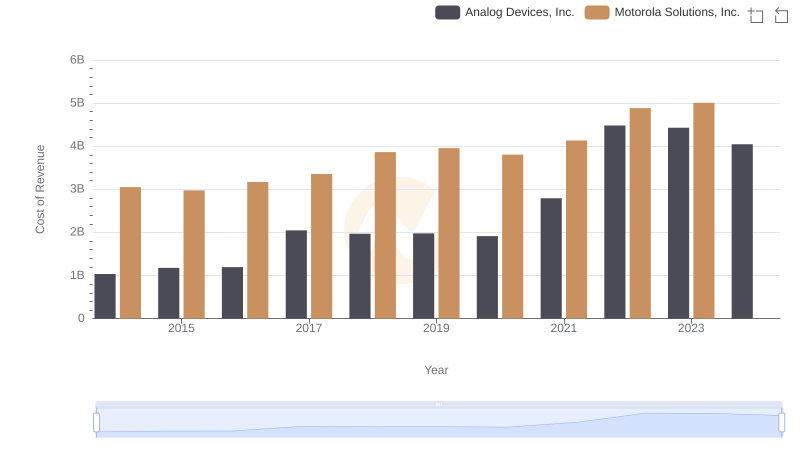
Cost of Revenue Comparison: Analog Devices, Inc. vs Motorola Solutions, Inc.
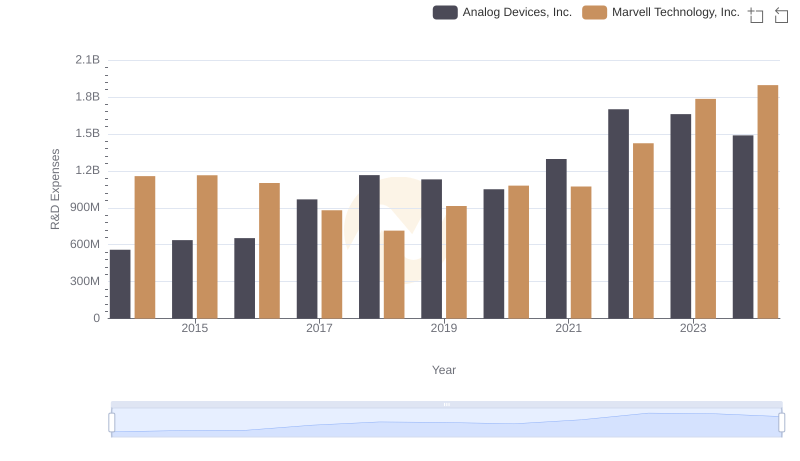
Analyzing R&D Budgets: Analog Devices, Inc. vs Marvell Technology, Inc.
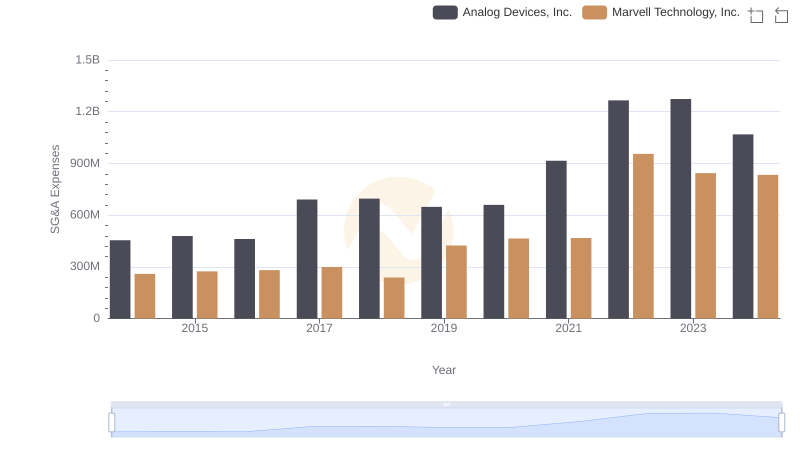
SG&A Efficiency Analysis: Comparing Analog Devices, Inc. and Marvell Technology, Inc.