| __timestamp | ASE Technology Holding Co., Ltd. | Cisco Systems, Inc. |
|---|---|---|
| Wednesday, January 1, 2014 | 13673000000 | 11437000000 |
| Thursday, January 1, 2015 | 14295000000 | 11861000000 |
| Friday, January 1, 2016 | 15099000000 | 11433000000 |
| Sunday, January 1, 2017 | 15767000000 | 11177000000 |
| Monday, January 1, 2018 | 19552000000 | 11386000000 |
| Tuesday, January 1, 2019 | 22389000000 | 11398000000 |
| Wednesday, January 1, 2020 | 23806000000 | 11094000000 |
| Friday, January 1, 2021 | 27191000000 | 11411000000 |
| Saturday, January 1, 2022 | 30384000000 | 11186000000 |
| Sunday, January 1, 2023 | 25930017000 | 12358000000 |
| Monday, January 1, 2024 | 27353513000 | 13177000000 |
Cracking the code
In the ever-evolving landscape of technology, effective cost management is crucial for maintaining competitive advantage. Over the past decade, Cisco Systems, Inc. and ASE Technology Holding Co., Ltd. have demonstrated contrasting strategies in managing their Selling, General, and Administrative (SG&A) expenses. From 2014 to 2023, ASE Technology's SG&A expenses surged by approximately 90%, peaking in 2022, while Cisco's expenses remained relatively stable, with a modest increase of around 15% over the same period. This divergence highlights ASE's aggressive expansion and investment in operational capabilities, whereas Cisco's steady approach reflects a focus on efficiency and cost control. Notably, 2023 saw a decline in ASE's expenses, suggesting a strategic shift or market adaptation. As we look to the future, these trends offer valuable insights into how these industry leaders navigate financial management amidst global challenges.
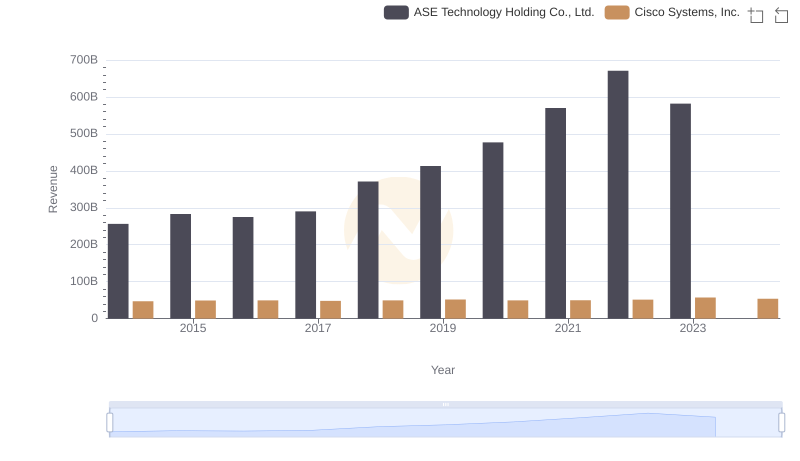
Cisco Systems, Inc. and ASE Technology Holding Co., Ltd.: A Comprehensive Revenue Analysis
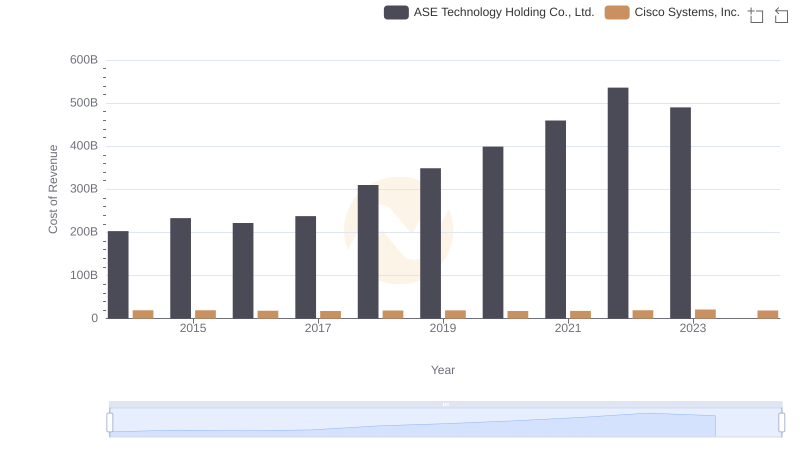
Analyzing Cost of Revenue: Cisco Systems, Inc. and ASE Technology Holding Co., Ltd.
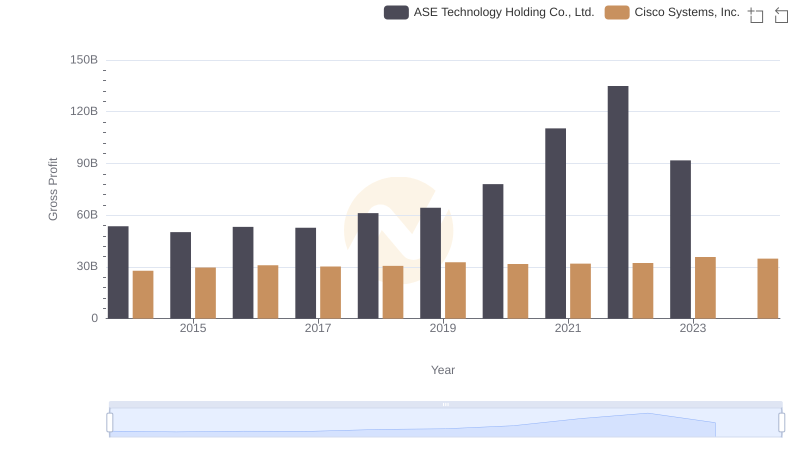
Cisco Systems, Inc. vs ASE Technology Holding Co., Ltd.: A Gross Profit Performance Breakdown
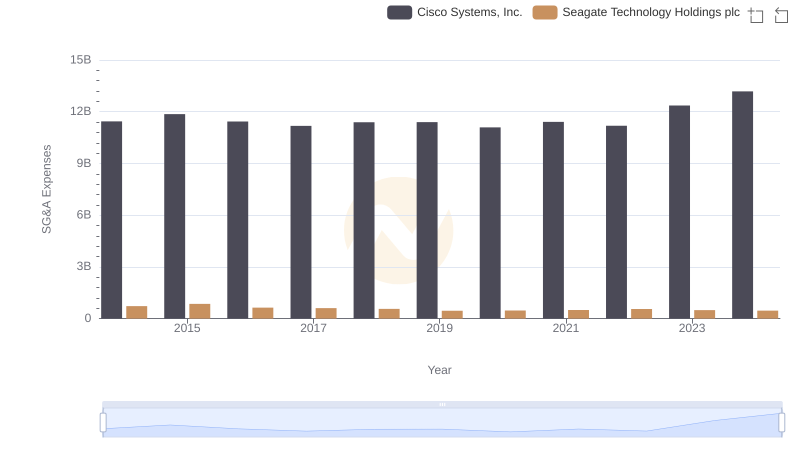
SG&A Efficiency Analysis: Comparing Cisco Systems, Inc. and Seagate Technology Holdings plc
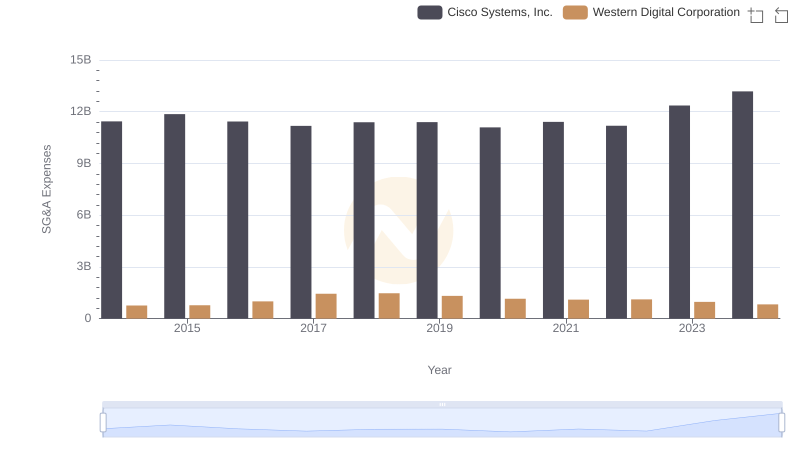
Breaking Down SG&A Expenses: Cisco Systems, Inc. vs Western Digital Corporation
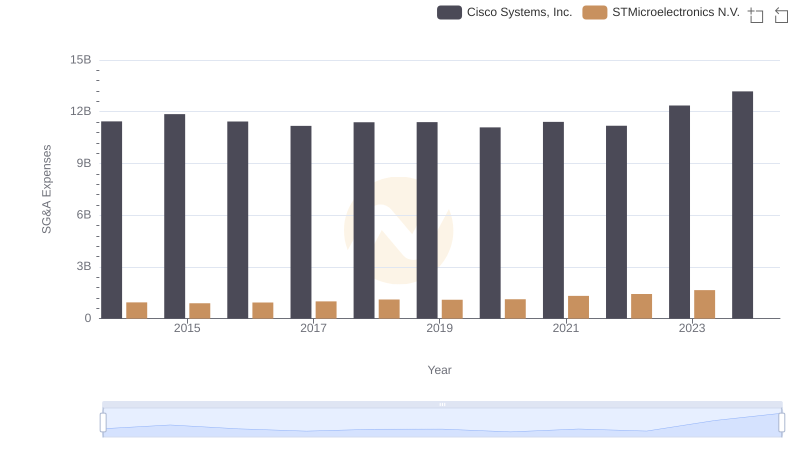
Operational Costs Compared: SG&A Analysis of Cisco Systems, Inc. and STMicroelectronics N.V.
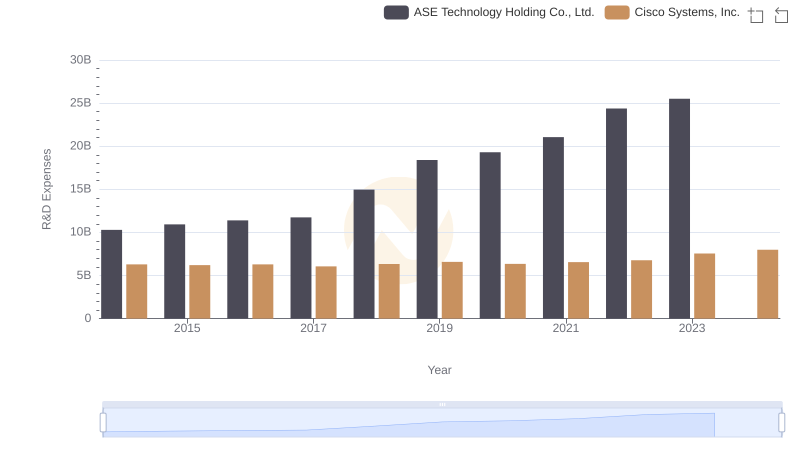
Cisco Systems, Inc. vs ASE Technology Holding Co., Ltd.: Strategic Focus on R&D Spending
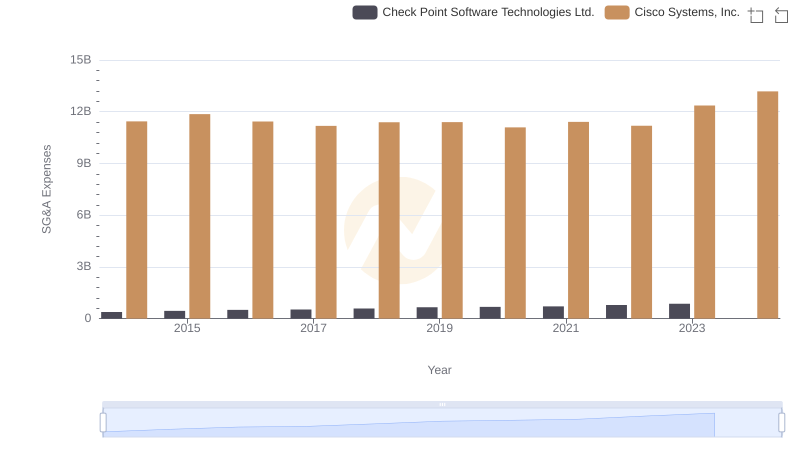
Cisco Systems, Inc. vs Check Point Software Technologies Ltd.: SG&A Expense Trends
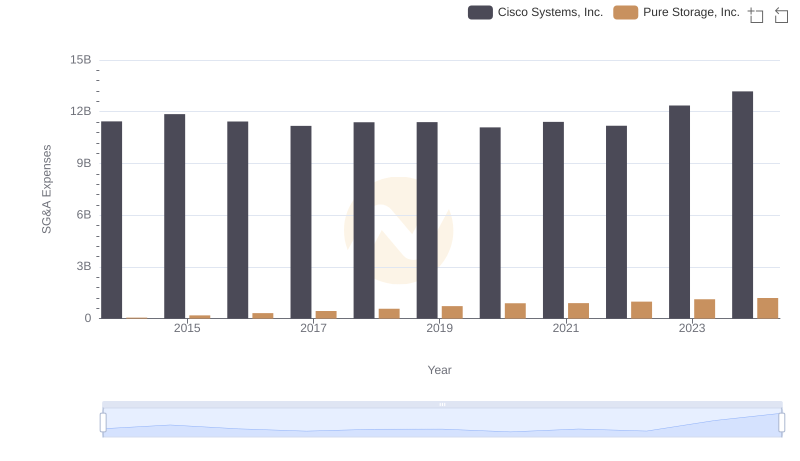
SG&A Efficiency Analysis: Comparing Cisco Systems, Inc. and Pure Storage, Inc.
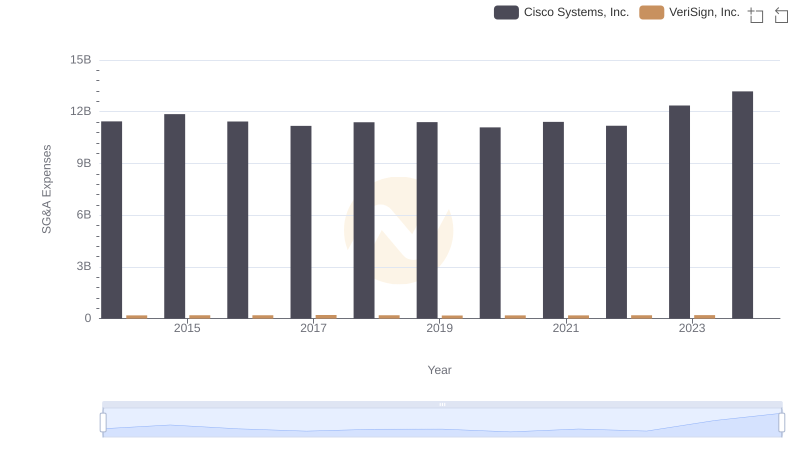
Cisco Systems, Inc. vs VeriSign, Inc.: SG&A Expense Trends
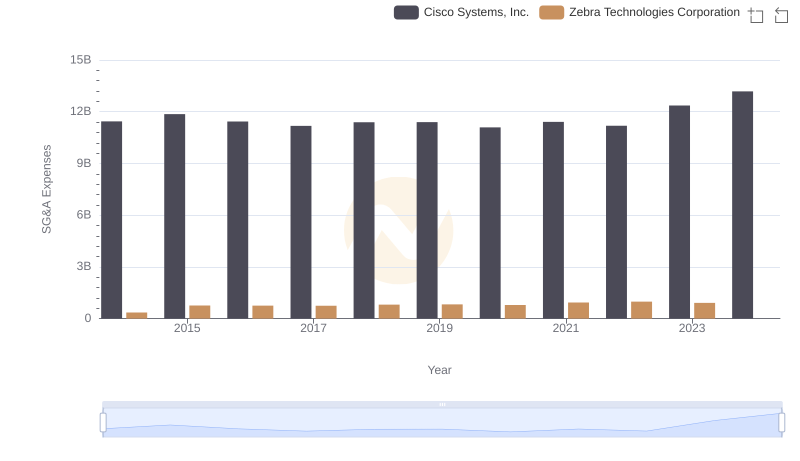
SG&A Efficiency Analysis: Comparing Cisco Systems, Inc. and Zebra Technologies Corporation
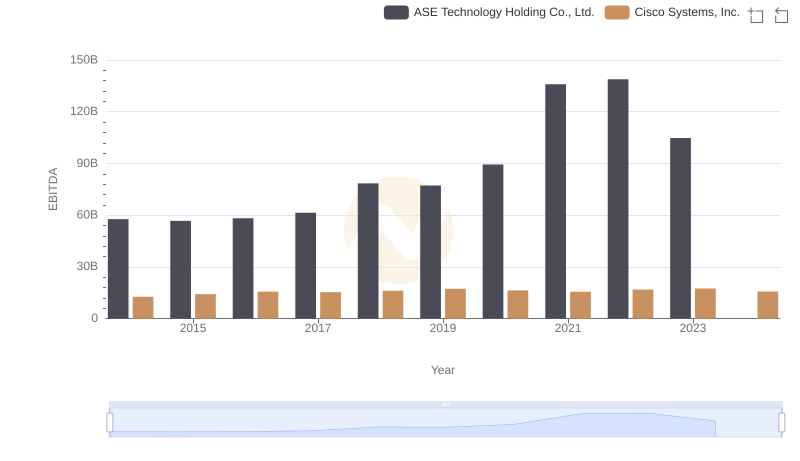
EBITDA Analysis: Evaluating Cisco Systems, Inc. Against ASE Technology Holding Co., Ltd.