| __timestamp | Cisco Systems, Inc. | Zebra Technologies Corporation |
|---|---|---|
| Wednesday, January 1, 2014 | 11437000000 | 351518000 |
| Thursday, January 1, 2015 | 11861000000 | 763025000 |
| Friday, January 1, 2016 | 11433000000 | 751000000 |
| Sunday, January 1, 2017 | 11177000000 | 749000000 |
| Monday, January 1, 2018 | 11386000000 | 811000000 |
| Tuesday, January 1, 2019 | 11398000000 | 826000000 |
| Wednesday, January 1, 2020 | 11094000000 | 787000000 |
| Friday, January 1, 2021 | 11411000000 | 935000000 |
| Saturday, January 1, 2022 | 11186000000 | 982000000 |
| Sunday, January 1, 2023 | 12358000000 | 915000000 |
| Monday, January 1, 2024 | 13177000000 | 981000000 |
Igniting the spark of knowledge
In the ever-evolving tech landscape, understanding operational efficiency is crucial. Cisco Systems, Inc. and Zebra Technologies Corporation, two stalwarts in the industry, offer a fascinating study in SG&A (Selling, General, and Administrative) expenses over the past decade. From 2014 to 2023, Cisco's SG&A expenses have shown a steady increase, peaking at approximately $13.2 billion in 2023, marking a 15% rise from 2014. In contrast, Zebra Technologies, while smaller in scale, has demonstrated a more volatile pattern, with expenses nearly tripling from 2014 to 2022, before a slight dip in 2023. This divergence highlights Cisco's consistent growth strategy versus Zebra's dynamic adjustments. Notably, data for 2024 is incomplete, suggesting potential shifts in Zebra's strategy. As these companies navigate the future, their SG&A efficiency will remain a key indicator of their competitive edge.
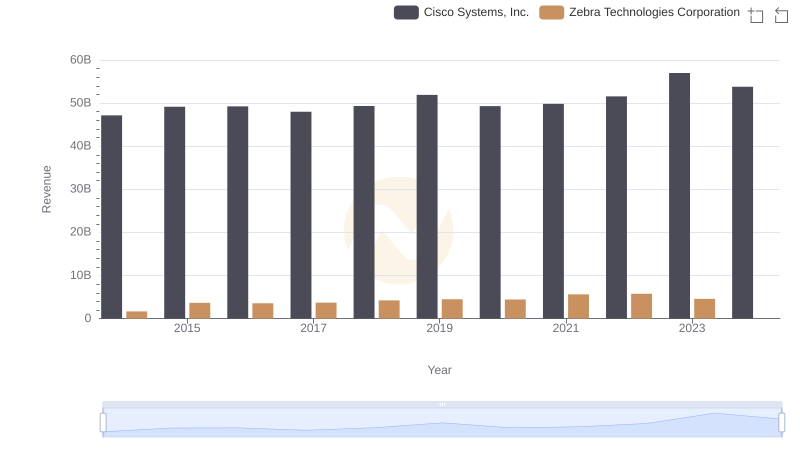
Cisco Systems, Inc. and Zebra Technologies Corporation: A Comprehensive Revenue Analysis
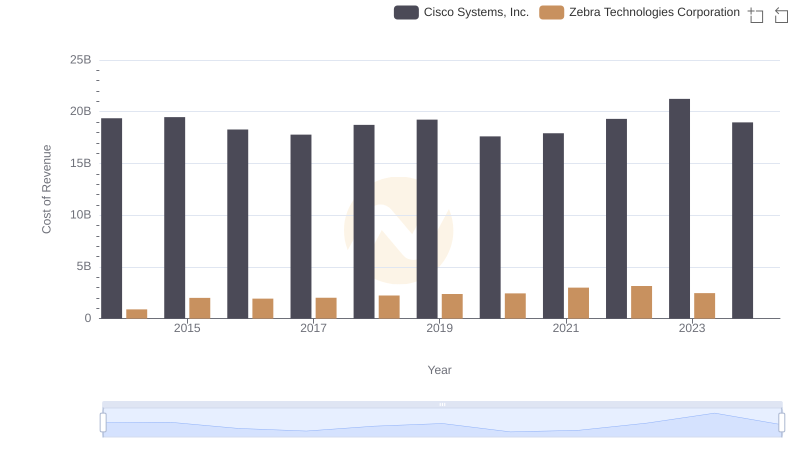
Cost Insights: Breaking Down Cisco Systems, Inc. and Zebra Technologies Corporation's Expenses
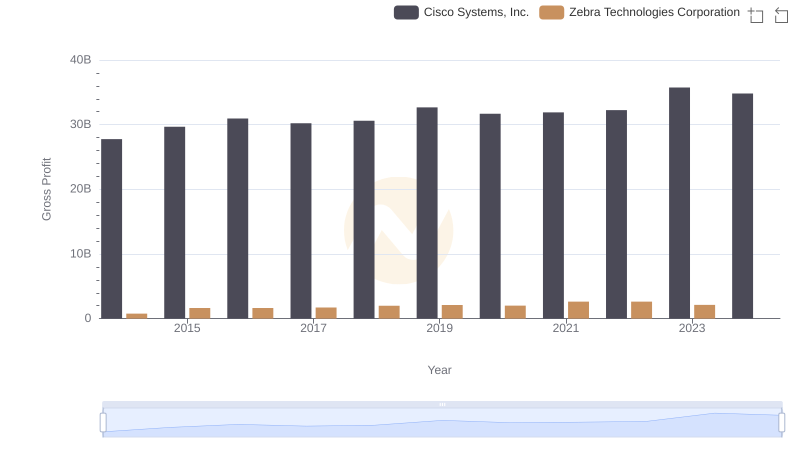
Key Insights on Gross Profit: Cisco Systems, Inc. vs Zebra Technologies Corporation
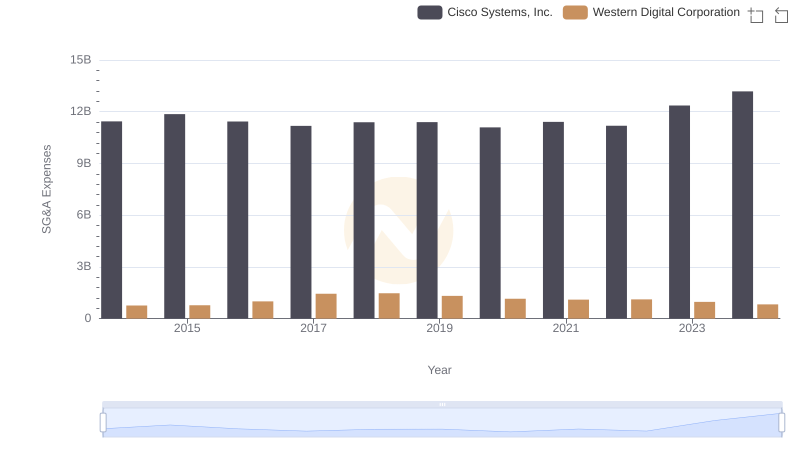
Breaking Down SG&A Expenses: Cisco Systems, Inc. vs Western Digital Corporation
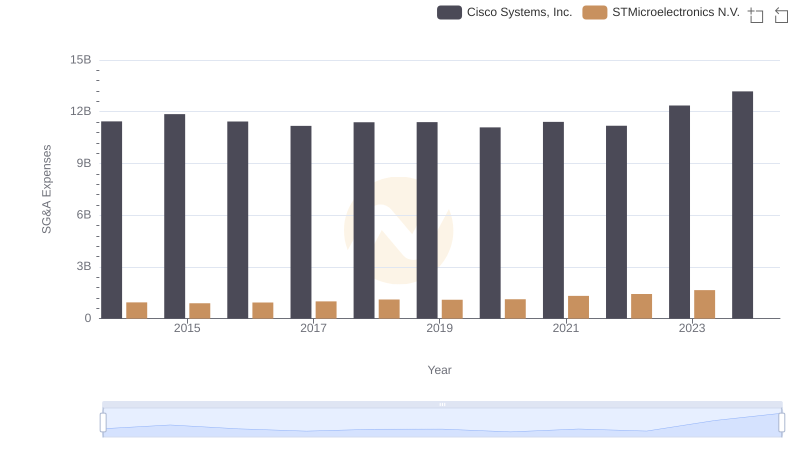
Operational Costs Compared: SG&A Analysis of Cisco Systems, Inc. and STMicroelectronics N.V.
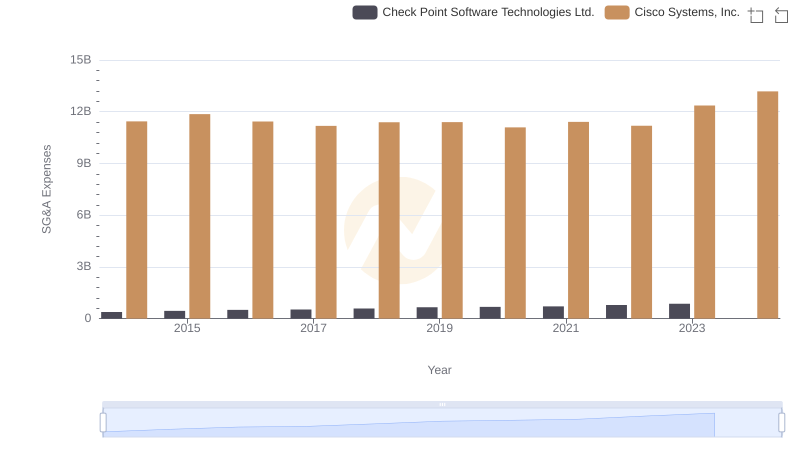
Cisco Systems, Inc. vs Check Point Software Technologies Ltd.: SG&A Expense Trends
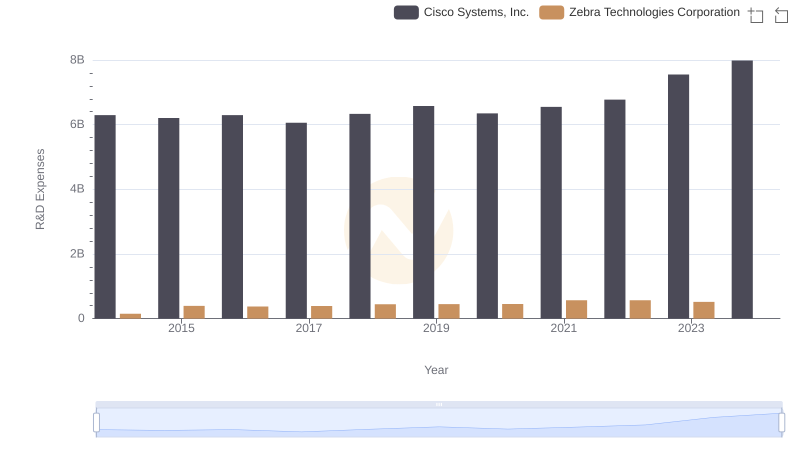
R&D Spending Showdown: Cisco Systems, Inc. vs Zebra Technologies Corporation
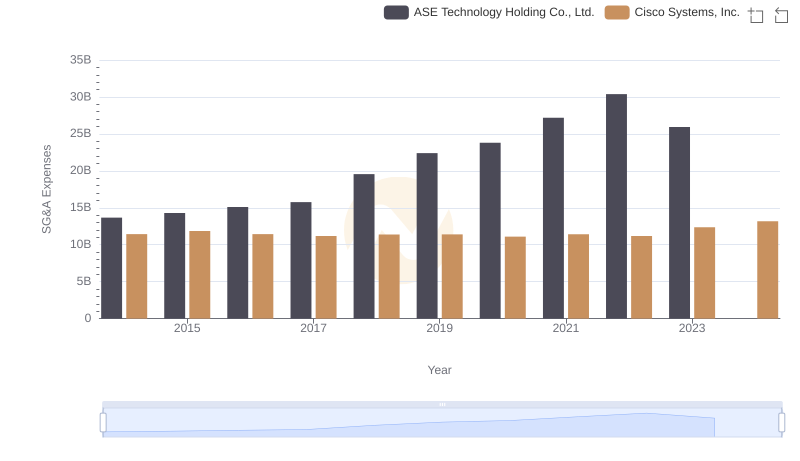
Cost Management Insights: SG&A Expenses for Cisco Systems, Inc. and ASE Technology Holding Co., Ltd.
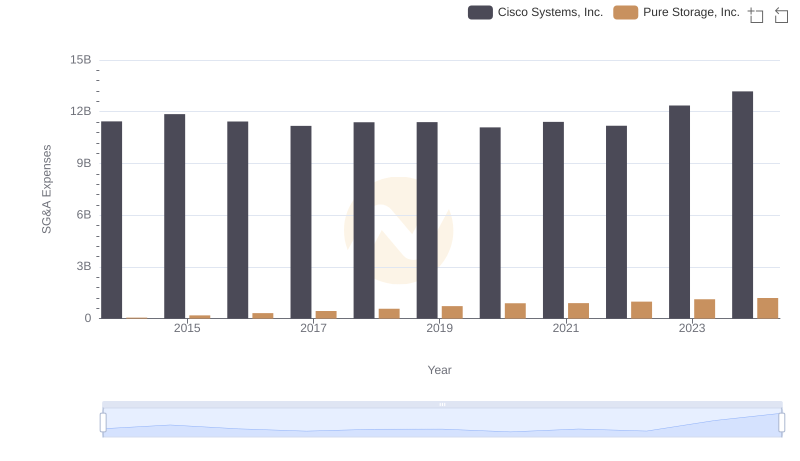
SG&A Efficiency Analysis: Comparing Cisco Systems, Inc. and Pure Storage, Inc.
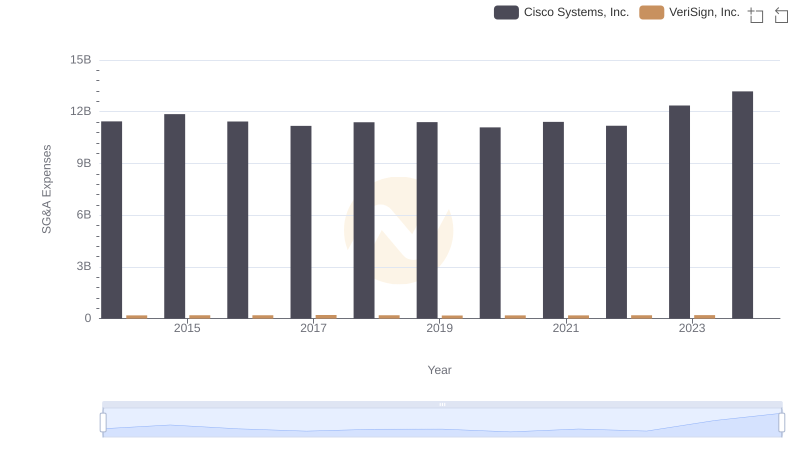
Cisco Systems, Inc. vs VeriSign, Inc.: SG&A Expense Trends
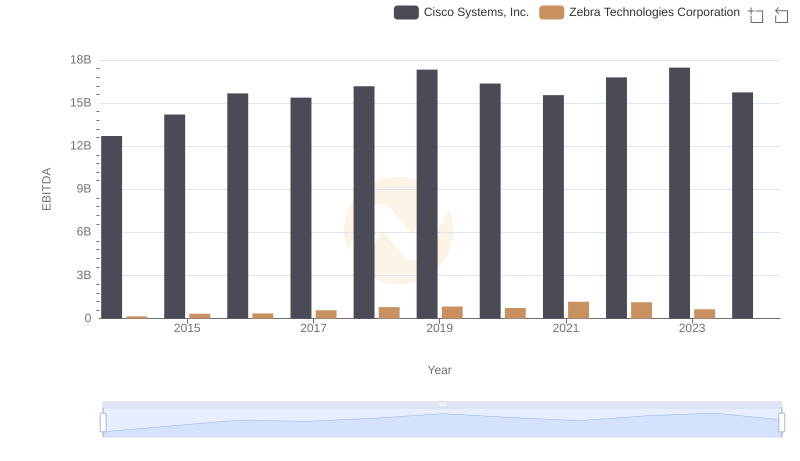
EBITDA Performance Review: Cisco Systems, Inc. vs Zebra Technologies Corporation
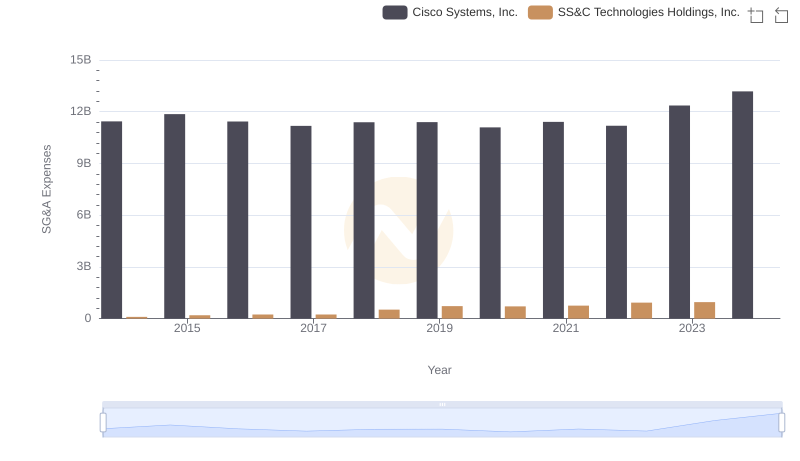
Cisco Systems, Inc. and SS&C Technologies Holdings, Inc.: SG&A Spending Patterns Compared