| __timestamp | Check Point Software Technologies Ltd. | Cisco Systems, Inc. |
|---|---|---|
| Wednesday, January 1, 2014 | 384921000 | 11437000000 |
| Thursday, January 1, 2015 | 451785000 | 11861000000 |
| Friday, January 1, 2016 | 508656000 | 11433000000 |
| Sunday, January 1, 2017 | 525392000 | 11177000000 |
| Monday, January 1, 2018 | 589799000 | 11386000000 |
| Tuesday, January 1, 2019 | 658400000 | 11398000000 |
| Wednesday, January 1, 2020 | 681400000 | 11094000000 |
| Friday, January 1, 2021 | 708500000 | 11411000000 |
| Saturday, January 1, 2022 | 791300000 | 11186000000 |
| Sunday, January 1, 2023 | 864100000 | 12358000000 |
| Monday, January 1, 2024 | 13177000000 |
Unveiling the hidden dimensions of data
In the ever-evolving tech landscape, understanding financial trends is crucial. Over the past decade, Cisco Systems, Inc. and Check Point Software Technologies Ltd. have shown distinct patterns in their Selling, General, and Administrative (SG&A) expenses. Cisco, a giant in networking, consistently outpaces Check Point, a cybersecurity leader, in SG&A spending. From 2014 to 2023, Cisco's expenses hovered around $11 billion, peaking at $12.4 billion in 2023, reflecting a strategic investment in growth and innovation. In contrast, Check Point's expenses grew steadily from $385 million in 2014 to $864 million in 2023, marking a 124% increase. This divergence highlights Cisco's expansive operational scale compared to Check Point's focused approach. Notably, 2024 data for Check Point is missing, suggesting a need for updated insights. These trends offer a window into each company's strategic priorities and market positioning.
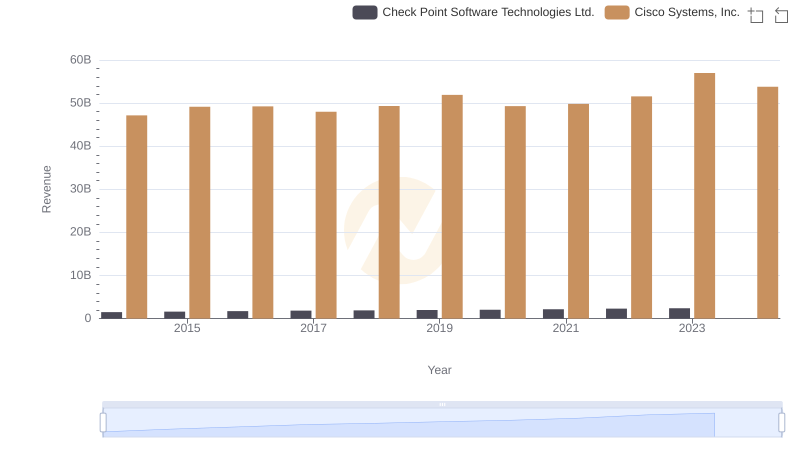
Annual Revenue Comparison: Cisco Systems, Inc. vs Check Point Software Technologies Ltd.
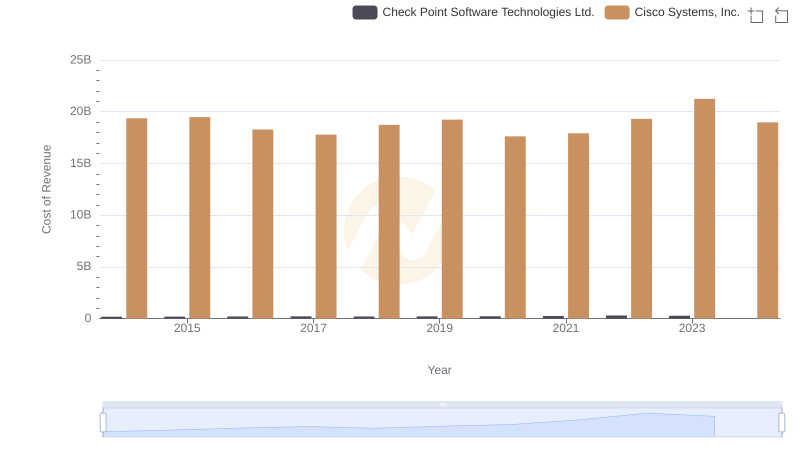
Cisco Systems, Inc. vs Check Point Software Technologies Ltd.: Efficiency in Cost of Revenue Explored
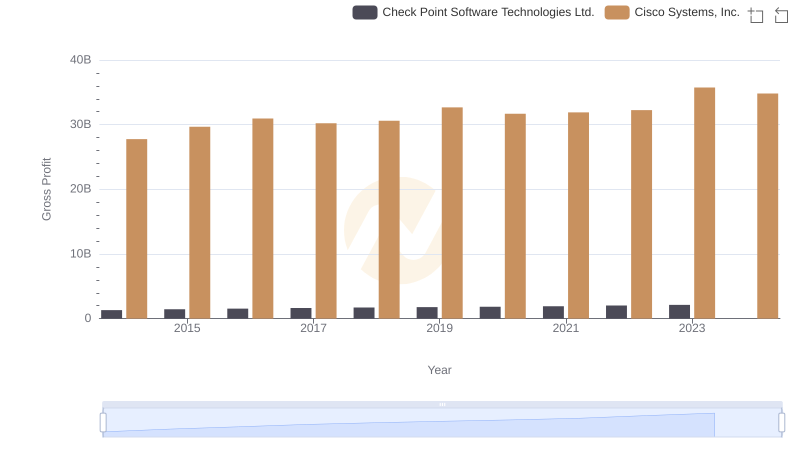
Key Insights on Gross Profit: Cisco Systems, Inc. vs Check Point Software Technologies Ltd.
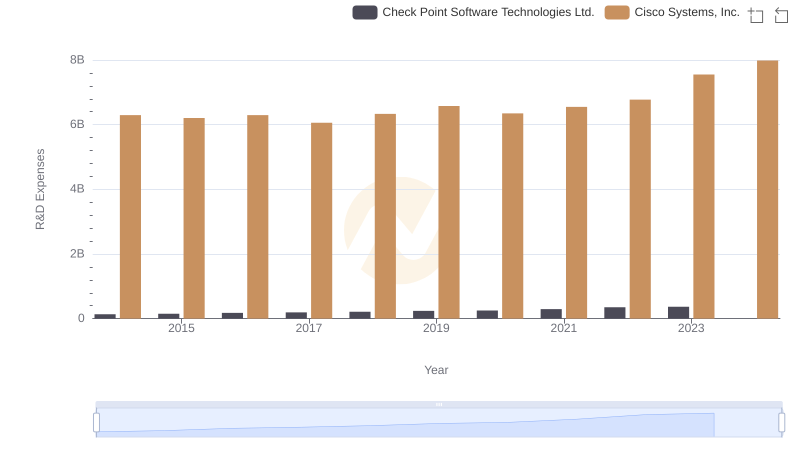
Cisco Systems, Inc. vs Check Point Software Technologies Ltd.: Strategic Focus on R&D Spending
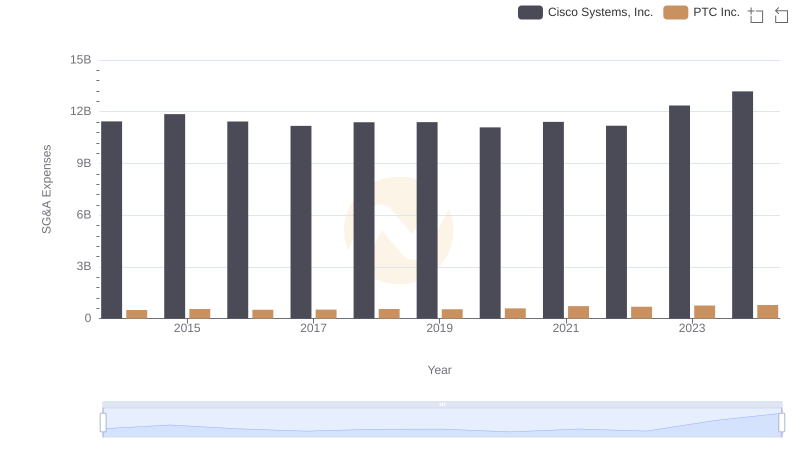
Cisco Systems, Inc. vs PTC Inc.: SG&A Expense Trends
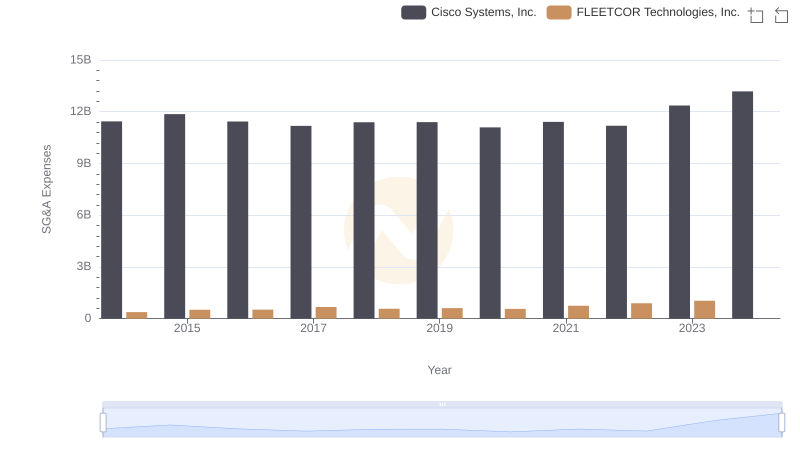
Cisco Systems, Inc. vs FLEETCOR Technologies, Inc.: SG&A Expense Trends
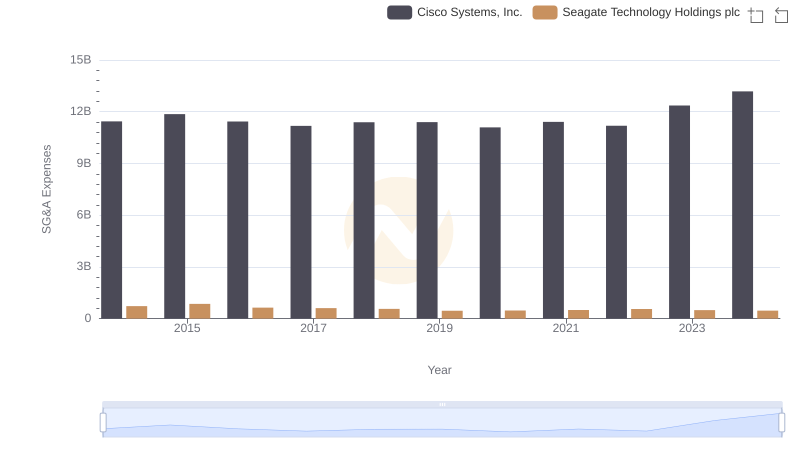
SG&A Efficiency Analysis: Comparing Cisco Systems, Inc. and Seagate Technology Holdings plc
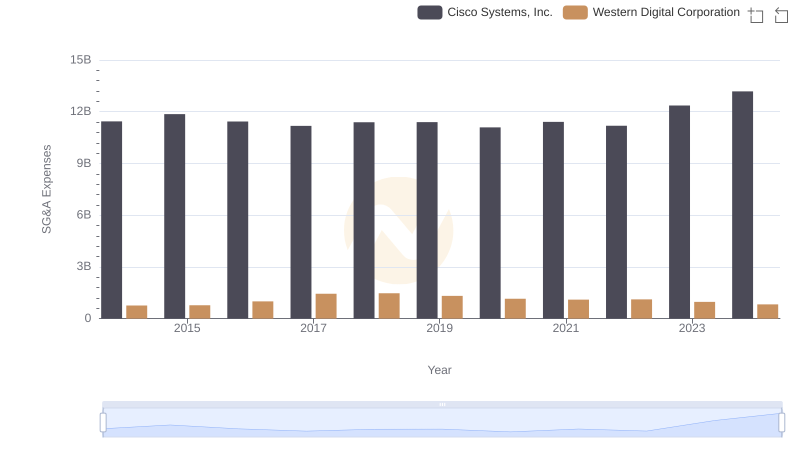
Breaking Down SG&A Expenses: Cisco Systems, Inc. vs Western Digital Corporation
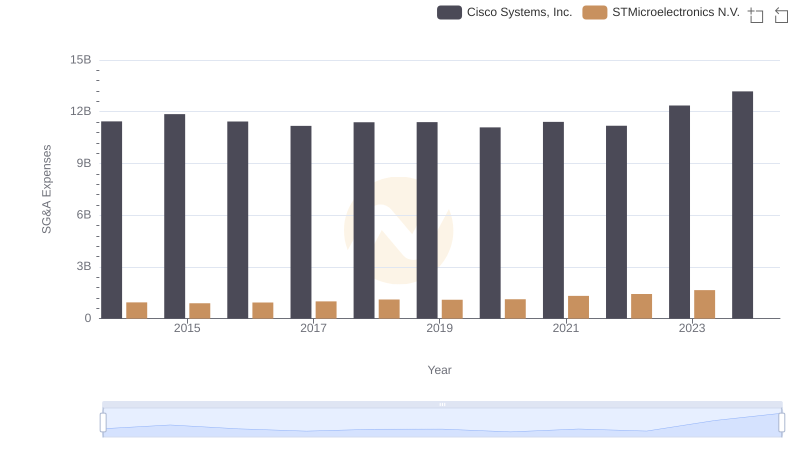
Operational Costs Compared: SG&A Analysis of Cisco Systems, Inc. and STMicroelectronics N.V.
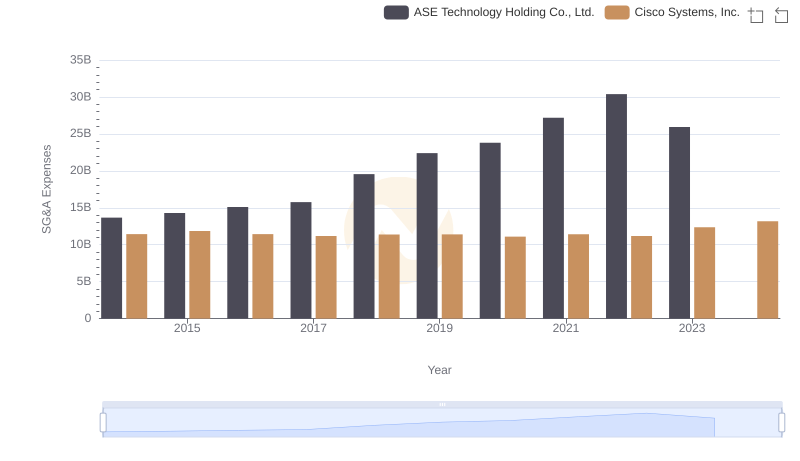
Cost Management Insights: SG&A Expenses for Cisco Systems, Inc. and ASE Technology Holding Co., Ltd.
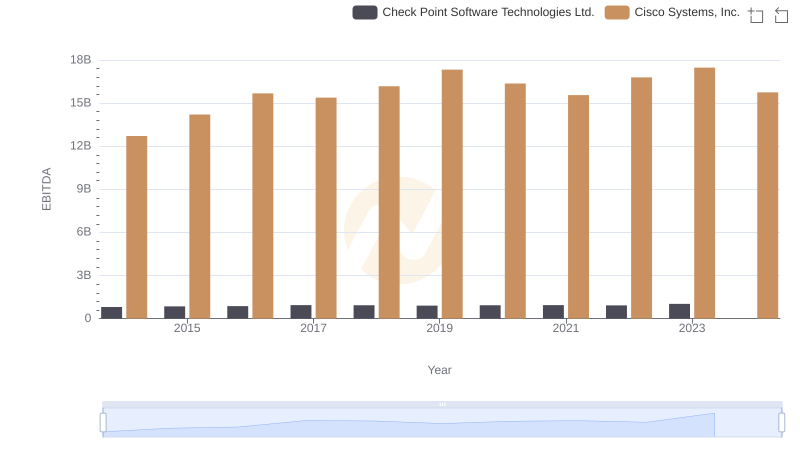
Comparative EBITDA Analysis: Cisco Systems, Inc. vs Check Point Software Technologies Ltd.
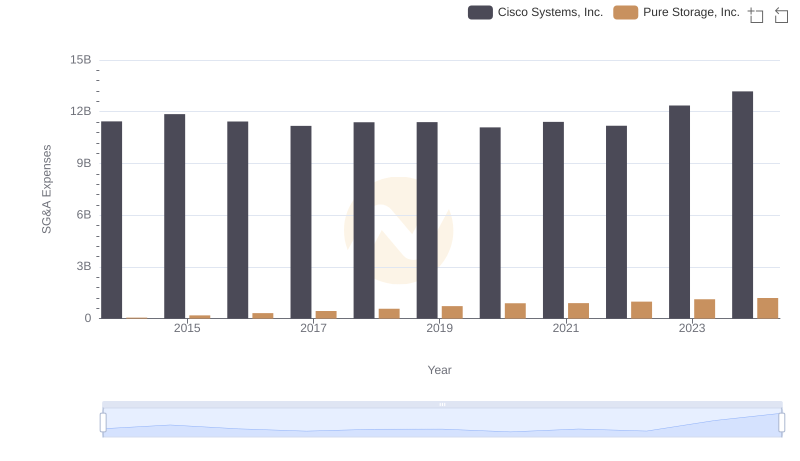
SG&A Efficiency Analysis: Comparing Cisco Systems, Inc. and Pure Storage, Inc.